National Carrier LTE Channels - Top 100 CMA Markets
Share
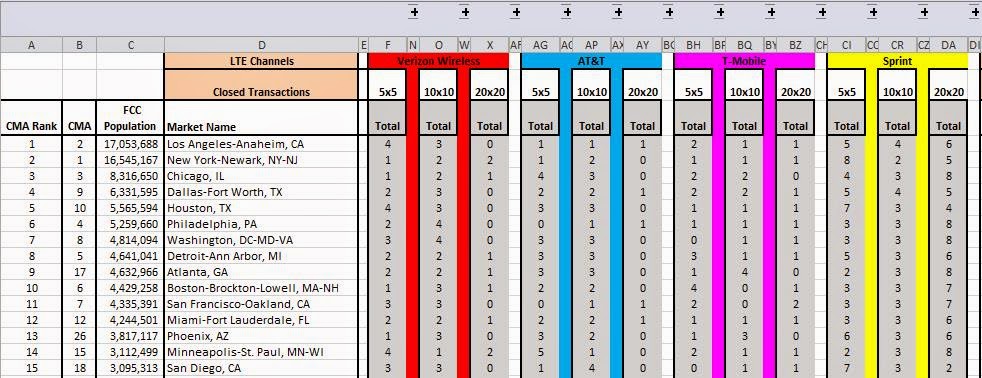
AllNet Labs is now offering a monthly spectrum report summarizing the LTE Channels for the National Carriers (Verizon, AT&T, Sprint, and T-Mobile). To develop this report, AllNet Labs takes the spectrum outputs at a county level from its Spectrum Analysis Tool and applies a county population weighting before averaging all of the counties within a Cellular Market Area (CMA). Data is available for all 733 CMA markets, but the standard report is formatted for the 100 most populated CMA markets. This report is delivered as an Excel spreadsheet, with both summary and detailed views. In the summary view (Figure 1), only the size and quantity of LTE channels for each carrier are displayed. This report evaluates each carrier’s complete spectrum holdings to determine the size and quantity of available LTE channels. The report also assumes that the largest channel would be utilized rather than multiple smaller channels (e.g. a 20MHz channel is assumed rather than 2 – 10MHz channels).
Figure 1
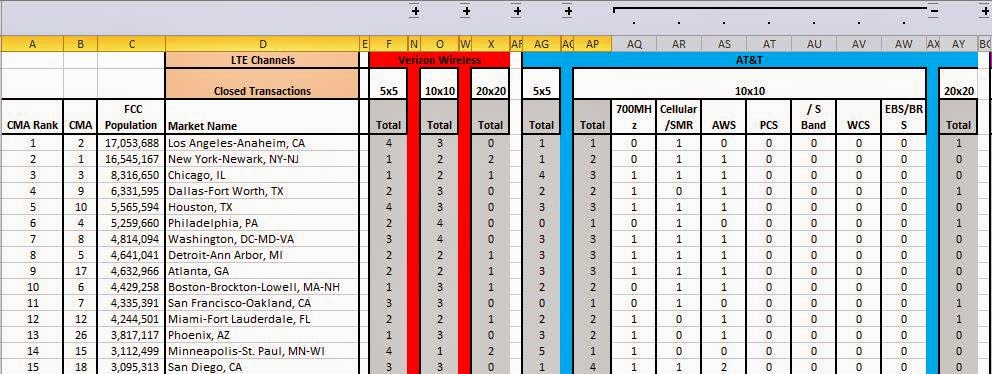
By selecting the [+] in the upper margin to the right of AT&T’s 10x10 column we can reveal t AT&T’s LTE channel distribution by band. This expanded view is seen below as Figure 2.
Figure 2
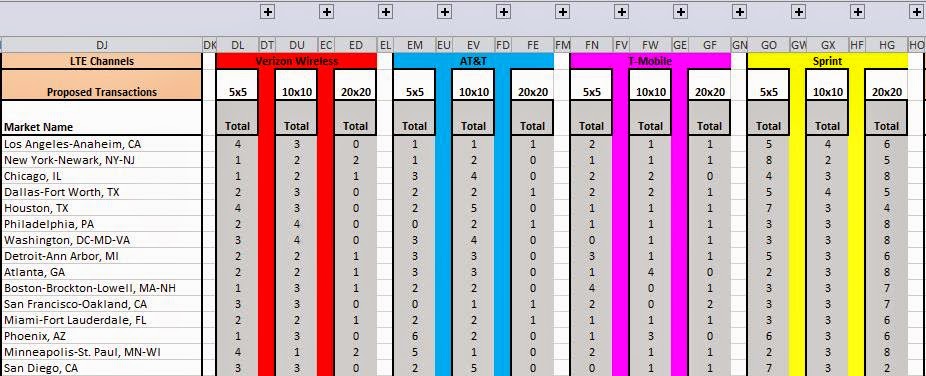
AllNet Labs has added a proposed transaction data set to the Spectrum Analysis Tool. With this data set, we are able to simplify hundreds of license transfers at the FCC into the net effect for wireless operators. All of the transactions are captured from the FCC Daily Digest and each license is updated at the callsign, county, and frequency levels. Using this proposed transaction data; a matrix of each carrier’s future LTE Channels is created (Figure 3).
Figure 3
By selecting the [+] signs in the upper margin, a carrier’s spectrum holdings by band can be detailed. (Figure 4).
Figure 4
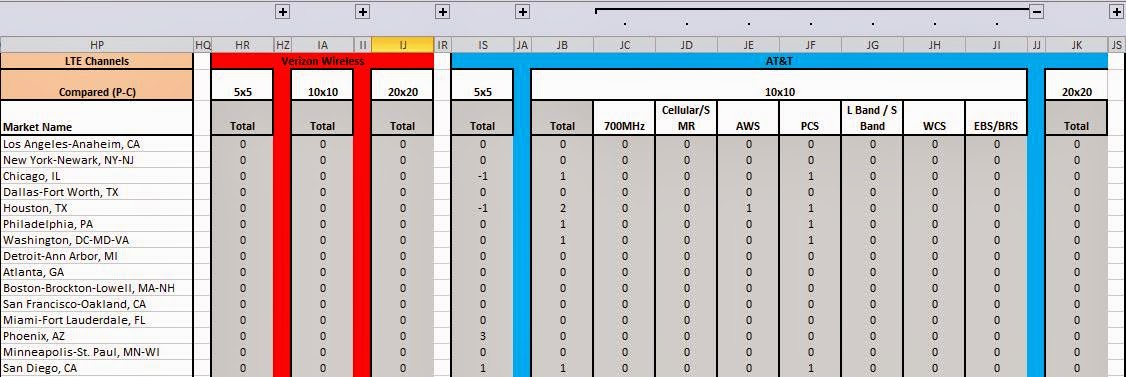
The last matrix in this report summarizes the differences between the proposed LTE Channels and the current LTE Channels. This highlights areas that are affected by proposed transactions. The example shown uses data from the December 2013 Spectrum Analysis Tool. The proposed transactions for December 2013 were transactions announced prior to 12/1 which included AT&T’s purchase of Leap as well as many other minor transactions. The effect of that transaction as well as other more minor transactions is easily seen in Figure 5, with AT&T increasing their LTE channel size from 5x5 to 10x10 in Chicago.
Figure 5
To see the changes at the spectrum band level of detail, select the [+] in the upper margin as described before. As seen in Figure 6, AT&T’s increase in 10x10 channels in Chicago was the result of an increase in the PCS spectrum band.
Figure 6
AllNet Lab's Spectrum Analysis Tool is an Excel based product which allows users to visualize and analyze the current spectrum ownership for all of the mobile carrier and satellite frequency bands at a county level for all 50 states and US territories. The Spectrum Analysis Tool includes 15 color-coded spectrum holders and over 600 additional identified carriers. More information can be found at www.allnetlabs.com.