Enhanced Market Level Reports
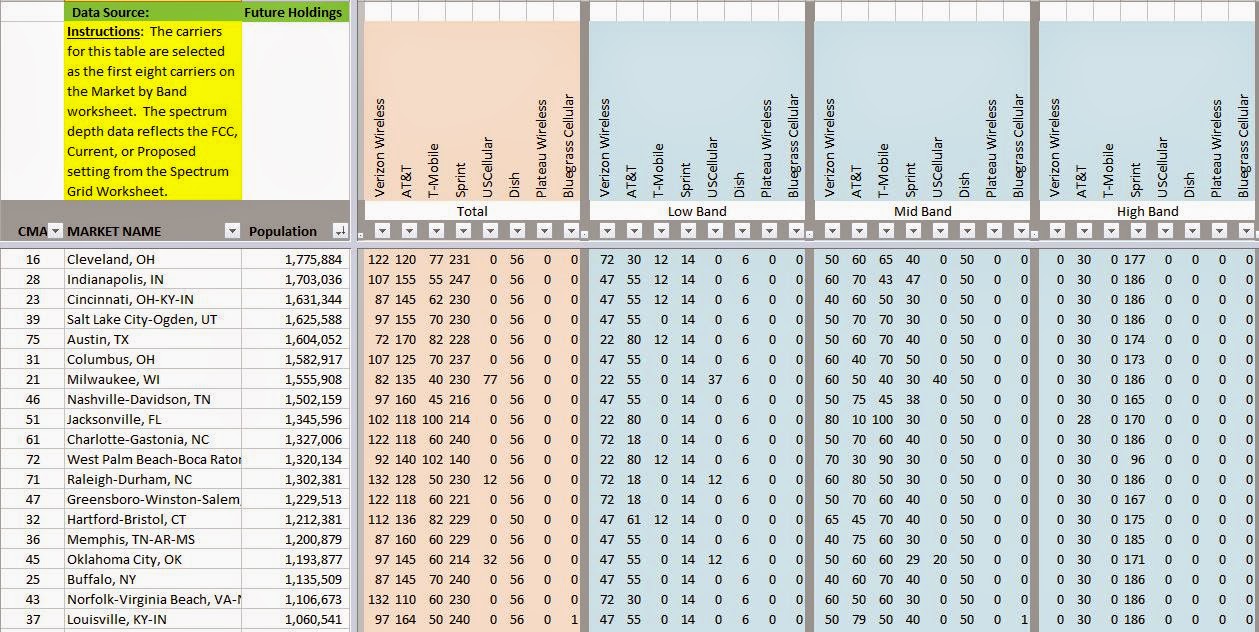
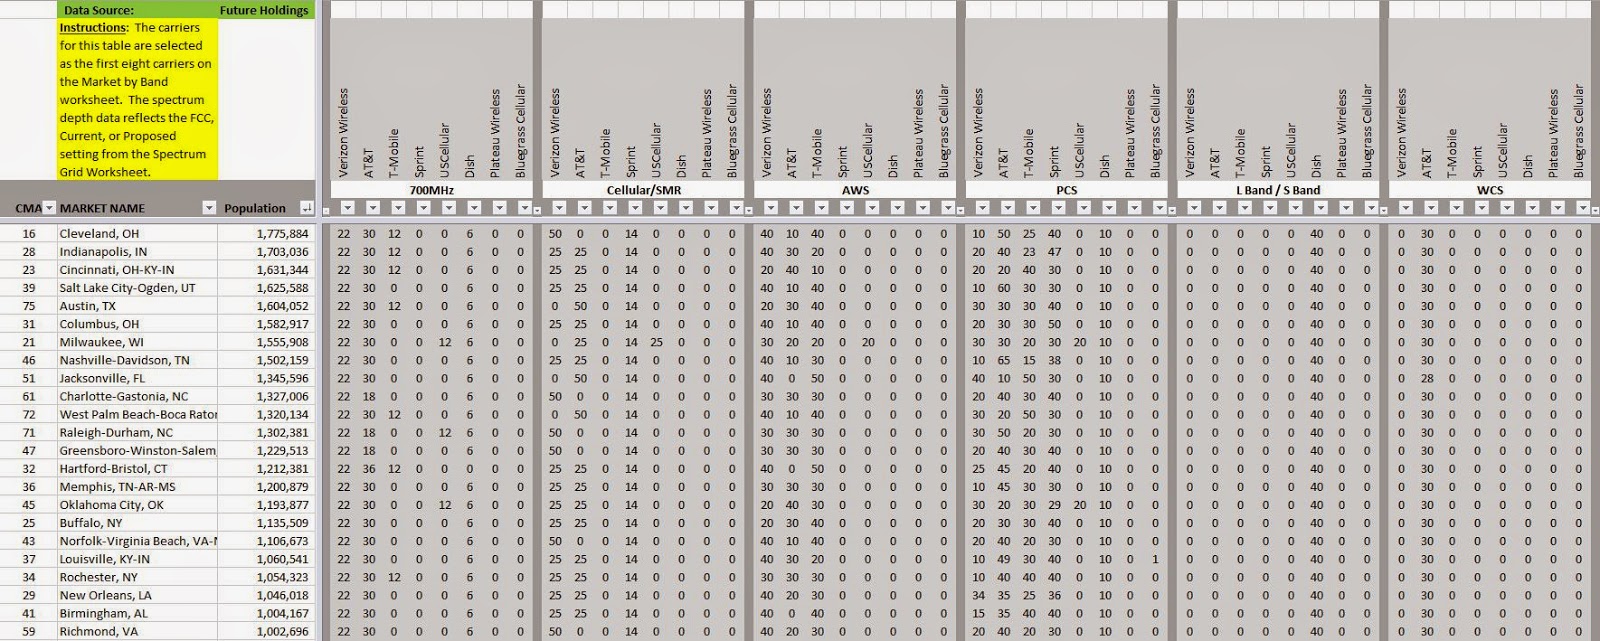
The November 2014 Spectrum Ownership Analysis Tool includes several enhancements to the Market Level Reports. Market Level Reports are available for Cellular Market Areas (CMA) and Economic Areas (EA). Initially these market level reports only included spectrum depth values for each carrier by spectrum band. With this update, you can see each selected carrier's total spectrum holdings, their spectrum holdings in each of the primary band classes (Low Band, Mid Band, and High Band), and their spectrum holdings in each spectrum band.
The band classes are defined as follows:
The band classes are defined as follows:
- Low Band
- 700MHz
- Cellular/SMR
- Mid Band
- L Band/S Band (AWS-4)
- AWS-1
- PCS
- AWS -3 (when the auction is complete)
- High Band
- WCS
- EBS/BRS
The user can select 8 carriers to be displayed in these reports from the 580 carriers available in the Spectrum Ownership Analysis Tool. For the examples below, we have included most of the national wireless carriers as well as a few regional carriers.
The spectrum depth values for each of these reports are determined from the county-level spectrum ownership information in the Spectrum Ownership Analysis Tool using a population-weighted average. This means that each of the county-level spectrum depth values is multiplied by a ratio of the county's population divided by the market population. This provides for a higher weighting for spectrum depth in higher population counties.
CMA Market Report - Total Spectrum Depth and Spectrum Depth by Band Class
CMA Market Report - Spectrum Depth by Frequency Band