${{amount}} USD

my cart

Free Shipping On world wide

  • HOME
  • PRODUCTS
  • IN THE NEWS
  • SPECTRUM BLOG
  • WEB SPECTRUM VIEWER

Spectrum Blog

Evaluating the Effects of FCC Spectrum Transactions - Liberty Puerto Rico Fri, Nov 10, 2023

Spektrum Metrics produces a weekly Spectrum Transactions Summary email that details the transactions that were filed that week by wireless carriers at the FCC.  Referring to this recent Transactions Summary, I am going to use Spektrum Metrics' Web Spectrum Viewer to investigate the effect of a series of transactions between Liberty and Claro, focused in the US Virgin Islands.  In the Transaction Summary email we link the FCC maps for all of the transactions where the licenses are disaggregated.  This can be seen in the transaction where part of a 700MHz spectrum license is being assigned from Claro to Liberty.  In this case, the 700MHz A block license includes Puerto Rico and the US Virgin Islands.  The assignment application is only asking for the US Virgin Island license areas (blue) to be transferred to Liberty.


To evaluate the effects of this transaction I will use the Web Spectrum Viewer to highlight the spectrum ownership changes for each island.  First looking at the 700MHz spectrum.  Claro's existing spectrum is indicated with PRT and Liberty's spectrum is indicated with LIB.  Acquiring Claro's 700MHz A block will increase Liberty's NR Band 12 Uplink and Downlink from 10MHz to 15MHz.   This will add approximately 120 Mbps to their uplink and downlink speeds.

US Virgin Islands - 700MHz Spectrum Ownership:

Looking at the AWS1 and AWS3 transactions, Liberty will expand their NR Band 66 channels size in two areas.  First, the combination of AWS1 B and C block will provide 1 - 15MHz channel and the AWS3 G and H block combination will provide a new 10MHz channel in NR Band 66.  The purchase of Claro's AWS/AWS3 spectrum increases Virgin's NR Band 66 spectrum from 15MHz to 35MHz.  This spectrum falls into 3 different channels for carrier aggregation.

US Virgin Islands - AWS1/AWS3 Spectrum Ownership:

I will take one addition look at the AWS3 and AWS4 spectrum with the news that Dish is selling its Puerto Rico and US Virgin Islands spectrum to Liberty.  With the Dish AWS-3 I block and the AWS-4 spectrum, Liberty will have a contagious block of 45MHz of spectrum in the NR Band 66 downlink.


Evaluating Spectrum Screens by Band Classifications Tue, Oct 24, 2023

Recently the FCC opened a comment period regarding an AT&T petition to establish a mid-band spectrum screen. I thought this would be a good opportunity to look at the spectrum screen components by band classification.
In the table below, we demonstrate how each of the Spectrum Screen values for Spektrum Metrics and the FCC roll up into each of the band classifications.  As a reminder, Low Band spectrum is good for coverage, Lower Midband spectrum balances bandwidth with coverage, and Upper Midband spectrum emphasizes bandwidth with less coverage that Lower Midband spectrum. 
In the far right column, we indicate what the FCC spectrum screen component would be for that particular band.  The historical FCC guideline has been to establish a spectrum screen at 1/3 of the total allotted spectrum.
  
To evaluate each carrier's Spectrum Screen with these band classifications, we updated the Spectrum Screen modules in our Spectrum Ownership Analysis Tool to detail the Spectrum Screen values  for each county and each Cellular Market Area (CMA).
 
County Spectrum Screen:
 
CMA Market Spectrum Screen:
 
In the following 3 charts, we highlight each of the national carrier's Spectrum Screen values for the Top 50 CMA markets by band classification.  You can visualize where the inputted FCC spectrum screen value from the table above would lie relative to each carrier's market values.
 
Low Band Spectrum Screen:
 
Lower Midband Spectrum Screen:
 
Upper Midband Spectrum Screen:

Market Spectrum Screens for the US National Carriers Wed, Oct 11, 2023

The recent news highlighting a FCC proceeding into the spectrum screen referenced, some analysis by Raymond James establishing T-Mobile dominance with 350MHz of spectrum on average in the nation's top markets.

To see how that plays out on a market by market basis, I am going to use the spectrum screen analysis data from Spektrum Metric's Spectrum Ownership Analysis Tool which details the spectrum that applies to the screen for all of the US counties or for all of the US Cellular Market Areas (CMA).  The chart below is for the Top 49 CMA markets by population (2021 estimated population). The markets are sorted from highest population on the left to the lowest population on the right. I have eliminated San Juan, PR because the national carrier's don't have a consistent investment strategy for many of the US territories including Puerto Rico.


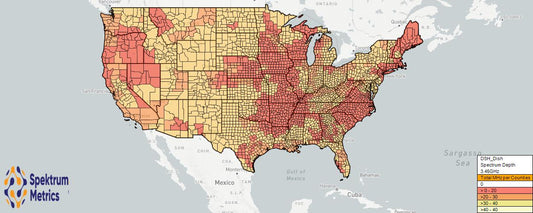
3.45GHz Auction Results Sat, Jan 15, 2022

On Friday, the FCC posted the results from Auction 110.  On Saturday we updated the January 2021 release of our Mobile Carrier - Spectrum Ownership Analysis Tool to reflect the auction results.  These results provide the most detailed view of each carrier's spectrum that can be deployed for 5G, particularly all of the available upper mid-band spectrum including EBS/BRS, 3.45GHz, CBRS, and C-band.

In the Spectrum Grid, we can see the channel allocations.  In general, Dish took the upper end of the band with T-Mobile and AT&T alternate having the lower parts of the band.  In many markets, AT&T is pinned in the middle of the band between T-Mobile, Grain, and Columbia Capital.  Each of the spectrum investors has selected spectrum assignments adjacent to AT&T's spectrum meaning they are each well positioned to sell to AT&T if the 3.45GHz spectrum cap is lifted. 

In the National Band Ownership slides we look at each carrier's ownership based upon the percent of MHz-POPs that they control.

For the 3.45GHz band, AT&T leads the way with 39% of the MHz-POPs, Dish has 30%, T-Mobile has 12%, and USCellular has 4%.  

Looking the the complete picture for Upper Mid-band spectrum, T-Mobile still leads with 34%, Verizon follows with 30%, then AT&T with 24%.  Dish has 9% of the upper mid-band MHz-POPs and USCellular has 2%.


How much spectrum does Dish have for its Las Vegas network? Tue, Jan 04, 2022

Last month Light Reading re-published results from Signals Research Group's testing of Dish's first 5G network in Las Vegas.

Signals Research indicated that Dish is using 5MHz of their AWS-3 spectrum, 10MHz of their 600MHz spectrum, and 25MHz of their AWS-4. 

Initially I was curious whether Dish deployed all of their available spectrum so I utilized our Spectrum Survey Tool, which lists each channel block in a selected county along with the operating details for each channel including the current and future operator.  Dish's spectrum for Clark County, NV is displayed below.  The channel blocks that Signal Research Group indicates that Dish is operating are shaded green.  From my understanding of Signal Research Group's test results, Dish can still expand their Las Vegas network to include the 700MHz E block supplemental downlink channel, the A1/B1 AWS-3 uplink channel, the remainder of their AWS-4 spectrum and their CBRS spectrum.


To see this in terms of spectrum depth, below is an output from our Spectrum Depth Analysis module highlighting each of the national carriers' spectrum depth by category in Clark County.


Which AWS-3 Licenses are at the center of the FCC - Dish Decision? Thu, Nov 19, 2020

Today, the FCC ruled that Dish should not have received small company discounts for their bidding partners in the AWS-3 auction, meaning that Dish would need to pay full price for the spectrum licenses won by Northstar and SNR or they would need to return the spectrum to the FCC for a re-auction.

Below is a map that reflects the AWS-3 spectrum that would be available at auction if Dish declines to pay the full auction price.

The next questions will focus on who could benefit most from this spectrum.  In the image below from our Spectrum Ownership Grid, the AWS-3 ownership for the Top 3 US markets are shown.  The columns filled with "FCC" indicate the spectrum that would be re-auctioned, so there would be a 5x5 channel in the New York EA (Economic Area Market) and a 10x10 channel in the Chicago market between the Chicago CMA (G channel) and the Chicago EA (H channel).  It is work noting that AT&T already has a strong position in these markets, but Verizon lacks AWS-3 spectrum in each of these markets, although no AWS-3 spectrum is available in the Los Angeles market.


T-Mobile's 600MHz Spectrum Leases - More work still needs to be done Tue, Sep 22, 2020

Last week, T-Mobile filed to lease 200 of Dish's 600MHz licenses after receiving Department of Justice (DOJ) approval for the leasing terms.  We are going to examine how these new leases will impact T-Mobile 600MHz network and identify the markets where work will need to continue on T-Mobile's part to consolidate their available 600MHz spectrum into a contiguous block for LTE, 5G, or both.  To start this analysis, we are going to look at the new T-Mobile leases for spectrum in the Top 20 Partial Economic Area Markets.
 
 
New York:
In the New York market, T-Mobile will add the D block to their spectrum portfolio.  In the image below from our Web Spectrum Viewer, you can see the D block still in Dish's control with our Future Holdings dataset.  As a reminder, our tools enable users to select to see either Licensed Holdings, Current Holdings, or Future Holdings in the Spectrum Ownership Grid.  Licensed Holdings reflects the carrier that directly owns that spectrum license, Current Holdings reflects either the current license owner or the long term lessee if the spectrum license is leased.  Future Holdings reflects the current operator of the license unless there is a pending assignment (acquisition) or a pending lease filed with the FCC for that particular license.  Since these T-Mobile leases were just filed, they will be rolled into our end of month update so after October 5th, the D block in this Future Holdings view will reflect TMO instead of DSH, but the Current Holdings will reflect DSH until the lease is finalized.  Now back to the effects on T-Mobile's network: Dish's D block will allow T-Mobile to increase their LTE/NR channel size from 10 MHz to 15 MHz in all 28 counties included in the New York PEA market.
 
It is also interesting to note that Comcast's A block in New York, is being leased by Charter.  This new lease application was also filed last week.  You can get access to these weekly spectrum transactions by subscribing to our Weekly Spectrum Transaction Summary.
 
 
Miami:
In Miami, the effect of T-Mobile leasing the F block is straightforward,  It will increase T-Mobile's LTE/NR channel size from 15 MHz to 20 MHz.
 
 
Detroit:
In Detroit, T-Mobile already controls 15 MHz of spectrum but the F block they are leasing from Dish is separated by the D block that Comcast (XFI) owns.  If T-Mobile actually owned the spectrum it would be relatively easy for Comcast and T-Mobile to exchange the F block for the E block, but with Dish owning the license, that exchange would have to be initiated between Dish and Comcast.
 
  
Orlando:
In Orlando, T-Mobile faces a similar challenge preventing them from utilizing the entire 15 MHz that they will control in the market.  This would need to be another trade between Dish and Comcast.
 
 
Cleveland:
In Cleveland, Dish's F block is again separated from T-Mobile's core 15 MHz holdings by a 5 MHz channel owned by Grain Management.  In this market T-Mobile will need Dish and Grain to agree to swap spectrum licenses so they can fully utilize the 20 MHz of spectrum they will have in this market.
 
 
San Diego:
In San Diego, T-Mobile will immediately be able to expand their 15 MHz LTE/NR channel to 20 MHz with Dish's F block channel.
 
 
Portland:
In Portland T-Mobile has another opportunity for Dish and Comcast to trade spectrum licenses.  The most logical exchange may actually be for Dish to trade their G block channel for Comcast's E block, so they still control 10 MHz of contiguous spectrum if they cancel T-Mobile's lease.  If this exchange took place T-Mobile could increase its channel size from 10 MHz to 15 MHz.
 

Assessing the COVID Temporary Spectrum Licenses Tue, Mar 31, 2020

Last week we began to see announcements from the FCC authorizing a series of temporary spectrum usage agreements to provide additional spectrum to several of the wireless operators to increase network capacity as workers are dispatched to their homes.

We will look at the effect of these agreements in a few markets to see how they are increasing LTE capacity.  The analysis will be supported with outputs from our Mobile Carrier - Spectrum Ownership Analysis Tool  specifically the Spectrum Ownership Grid.

T-Mobile 600MHz Capacity Expansion:

The first agreement provides T-Mobile with access to 600MHz spectrum from Bluewater Wireless, Channel 51 LIcense Co and LB License Co (Columbia Capital), CC Wireless Investment (Comcast), ParketB.com Wireless (Dish), New Level (Grain), and Tstar License Holdings (Tri-Star).

In the image below for the New York CMA market, T-Mobile will have access to Comcast's spectrum (XFI) and Dish's spectrum increasing their 600MHz channel size in New York from 10MHz channel to a 20MHz channel.  T-Mobile would have access to the entire 35MHz of spectrum so they could provide a 20MHz channel and a 10MHz channel for capacity.   Because T-Mobile has already deployed Band 71 equipment in New York, they can turn up the expanded spectrum without additional equipment installations.


USCellular AWS-3 Capacity Expansion:

The next agreement provides USCellular access to AWS-3 spectrum from their bidding partner Advantage Spectrum.  In the image below a few of the Washington markets where USCellular will access AWS-3 spectrum are indicated.  In most of these markets, USCellular currently operates on their cellular frequencies but doesn't have Band 66 operations.Thus,  USCellular will need to add base stations and antennas to their sites for Band 66 to utilize these new frequencies.  In five of these counties USCellular is likely operating on AWS-1 spectrum in Band 66 so the spectrum will be easier to deploy in those counties. 


Verizon AWS-3 Capacity Expansion:

In the image below we illustrate the AWS-3 spectrum that Verizon will gain temporary access from SNR License Co and Northstar Wireless (both Dish partners).  Northstar controls the AWS-3 G channel and SNR LIcense Co controls the AWS-3 H channel.  In the New York market, Northstar Wireless owns the G block spectrum and SNR Wireless owns the H block spectrum.  Accessing this spectrum will provide Verizon a second Band 66 LTE channel, increasing their LTE capacity from 20MHz to 30MHz.


Verizon & AT&T AWS-3 Capacity Expansion:

Verizon and AT&T have also requested access to the spectrum that Northstar Wireless and SNR Wireless returned to the FCC when their auction discounts were eliminated.  The AWS-3 spectrum depth that is "unassigned" is indicated in the map below.  In our data, we reflect these unassigned licenses with the FCC heading.


AT&T requested the I block spectrum in the New York market, so it will expand their Band 66 LTE from 10MHz to 15MHz.  The markets AT&T requested are listed here and the markets that Verizon requested are here.


AT&T AWS-4 Capacity Expansion:

AT&T has also requested access to Dish's Band 66 spectrum.  From the image above AT&T can expand their Band 66 LTE by and additional 5MHz to 20MHz by using part of Dish's AWS-4 spectrum.  AT&T will still have an additional 15MHz of Dish's spectrum that they could use as an additional LTE channel in New York.  AT&T only requested access to Dish's Band 66 spectrum, not their Band 70 AWS-4 spectrum.

AT&T 700MHz E-block Expansion:

Dish also reported that AT&T requested access the the 700MHz E-block in the markets that AT&T doesn't own.  In the image below, Dish's ownership in Chicago and Detroit will provide AT&T the capability to expand their Band 29 supplemental downlink from 5MHz to 10MHz.


Auction 103 Millimeter Wave - Spectrum Ownership Analysis Tool Update and Release Thu, Mar 12, 2020

Spektrum Metrics Insights & Analytics is pleased to announce that our Millimeter Wave - Spectrum Ownership Analysis Tool has been updated with the Auction 103 results and is available for purchase.

Below is a sample of the Spectrum Grid Analysis Module, highlighting the 37/39 GHz spectrum ownership for the New York, Los Angeles, and Chicago CMA markets.

The Millimeter Wave - Spectrum Ownership Analysis Tool contains 20 additional analysis modules including:

  • Spectrum Depth - County
  • Spectrum Depth - Company Profile
  • Spectrum Depth - NR Band Class
  • Spectrum Depth - Frequency Band
  • Spectrum Depth - Market
    • Cellular Market Area (CMA)
    • Partial Economic Area (PEA)
    • Designated Market Area (DMA)
  • Spectrum Depth - Country
  • Spectrum Depth - State
  • Spectrum Depth - Channel
  • Licensed POPs Analysis
    • By Channel
    • By Frequency Band
  • MHz-POPs Analysis
    • By Frequency Band
    • By Country
  • NR Channel Analysis 
  • Contiguous Spectrum Analysis
  • Frequency Band Ownership Analysis

With our Web Spectrum Viewer subscription, maps for each carrier's total Millimeter Wave spectrum depth and their spectrum depth for each frequency band are available.  Below is a map for the 47GHz spectrum that Sprint won in Auction 103.

Click here to contact Spektrum Metrics Insights & Analytics.


Five Important Ways to Look at Spectrum - Featuring the MVDDS (12.2 GHz) Spectrum Thu, Jan 30, 2020

What is the best report to use to understand the ownership for each block of spectrum or each carrier's spectrum portfolio?  I am going to walk through five of my favorites, using the Multichannel Video and Data Distribution Service (MVDDS) band as an example of a band where the spectrum owners and their relative ownership is not widely known.  The MVDDS 5G Coalition has been pressing the FCC since 2016 to make the 12.2-12.7 GHz band available for 5G. 

The first place to start is looking at the National Spectrum Depth averages.  This can be done with our National Weighted Average Spectrum Depth charts.    The chart below describes the average amount of spectrum that the 8 primary carriers own in the MVDDS band.  Since this band includes 500 MHz of spectrum in all markets, Dish is the majority spectrum holder, controlling 377 MHz of spectrum on average.  Because the National Weighted Average Spectrum Depth charts include of all of the millimeter wave spectrum bands, it is clear that Dish is the only MVDDS licensee that also owns traditional millimeter wave spectrum.

National Average Spectrum Depth:

The population weighted average spectrum depths are influenced significantly by the amount of spectrum held in population centers, so looking at Licensed Population values will provide insight into how much of the US population can be reached with each carrier's MVDDS licenses.  From the chart below, Dish's licenses can reach 75% of the  US population, with RS Access reaching 13%, and Go Long Wireless reaching nearly 5%.

Licensed Populations:

The next view, is to looking at the Top 25 or Top 50 population centers.  Using the CMA Market Analysis Module, in our Millimeter Wave - Spectrum Ownership Analysis Tool, it is easily seen that Dish controls the MVDDS spectrum in all of the Top 25 CMA markets except for Baltimore MD, where the spectrum is owned by Go Long Wireless.

Top 25 CMA Markets:

Next, to look at this spectrum band from a valuation perspective, it makes sense to detail the MHz-POPs that each carrier controls.  MHz-POPs is calculated by multiplying the size of the spectrum (500 MHz) times the population of each county where it is controlled.  Totaling these values for all counties provides the national band ownership quantity.

MHz-POPs:

Geographic Maps are fairly self explanatory.  Maps highlight areas not served, overserved, and highlight geographically adjacent markets that would be difficult to identify in the tabular results we have discussed above. Included in the maps below is a map detailing the licenses that the FCC now controls.  These typically include cancelled and terminated licenses.

Geographic Maps:

Dish Licenses:

Cass Cable Licenses:

FCC Licenses:

RSA Access:


Telus Expands Band 66 Capacity in Canada Tue, Aug 13, 2019

Last month, Telus applied and was approved to lease part of the AWS-4 spectrum band in Canada from Terrestar.  Terrestar owns both parts (uplink and downlink) of the AWS-4 band for all of Canada.  In Canada, the AWS-4 band is still configured for duplex (FDD) operation where in the US, Dish received approval to operate all of the spectrum for downlink.

Telus will be leasing the spectrum in the most urban areas of Canada, not including Toronto with typically 20MHz spectrum leases.  Telus is leasing this spectrum over a population of 13 million, roughly 38% of Canada's population. Below are geographic maps indicating each of the areas where Telus will be leasing spectrum. In Canada spectrum leases are called subordinations of licenses.  We will discuss why this spectrum is important to Telus below with outputs from our Canadian Mobile Carrier - Spectrum Ownership Analysis Tool.


From the Spectrum Grid below, Telus is acquiring the downlink AWS-4  spectrum which lies within Band 66 which is now widely deployed in the US for both the AWS-1 and AWS-3 bands.  This will provide immediate service improvements once the network is constructed because handsets have been supporting Band 66 for several years.  The remaining part of the AWS-4 spectrum (for uplink), would fall into Band 23, which has little to no handset support.


We can see a second reason for acquiring this spectrum by looking at the Company Analysis module, detailing Telus's spectrum holdings in each of these Tier 4 service areas.


In many of these Tier 4 service areas (similar to US counties), Telus has limited or no BRS (2.5GHz) spectrum.  The BRS spectrum they do control in these markets is paired (FDD) Band 7 rather than the TDD Band 41 that Sprint controls in the US.   Overall, this spectrum acquisition provides Telus with an immediate capacity improvement since they can expand their Band 66 downlink capacity by 10 or 20MHz.


Weekly FCC Spectrum Transactions Mon, Oct 22, 2018

Since blog postings of our Weekly Spectrum Transaction Summary emails are behind a subscription wall, I am posting last week's summary to show the detailed information that will arrive at your inbox every Friday, covering both the Mobile Carrier (600MHz-2.5GHz) and Millimeter Wave (12.2GHz-47GHz) transactions filed the previous week.
FCC Transactions - October 17, 2018
In this week's FCC transactions we see 4 transaction themes.  First, we see Cimaron Telephone / Cross Cable leasing an AWS3 license from Cross Telephone (a parent company).  Second, we see GE MDS leasing 4 - 700MHz Guard band licenses across the South and Southwest.  Third, we see a large filing from SpeedConnect providing them access to a varying number of channels on 35 call signs across the midwest, primarily in rural or low population areas.  The owned BRS channels are involved in most of these transactions which is surprising because it is Sprint's premium spectrum holding in all of these markets.  Most of these channels cover entire BTA market areas with contiguous spectrum.  Fourth, we see T-Mobile leasing RigNet's 700MHz C band license covering the entire Gulf of Mexico.  This will enable T-Mobile to build their LTE network for the oil platforms in the gulf.
Purpose Assignee Assignor CallSign Map RadioService Market ChannelBlock
New Lease Cimaron Telephone Cross Telephone Company WRBQ838 AWS3 CMA598 - Oklahoma 3 - Grant G
New Lease GE MDS LLC Access 700 WPRR314 700MHz GB MEA025 - Nashville A
New Lease GE MDS LLC Access 700 WPRV427 700MHz GB MEA008 - Atlanta A
New Lease GE MDS LLC Access 700 WPRV430 700MHz GB MEA024 - Birmingham A
New Lease GE MDS LLC Access 700 WPRV439 700MHz GB MEA038 - San Antonio A
New Lease SpeedConnect Sprint B064 Map BRS BTA064 - Butte, MT BRS1
New Lease SpeedConnect Sprint B064 Map BRS BTA064 - Butte, MT E4
New Lease SpeedConnect Sprint B064 Map BRS BTA064 - Butte, MT F1
New Lease SpeedConnect Sprint B064 Map BRS BTA064 - Butte, MT F2
New Lease SpeedConnect Sprint B064 Map BRS BTA064 - Butte, MT F3
New Lease SpeedConnect Sprint B064 Map BRS BTA064 - Butte, MT F4
New Lease SpeedConnect Sprint B064 Map BRS BTA064 - Butte, MT H1
New Lease SpeedConnect Sprint B064 Map BRS BTA064 - Butte, MT H2
New Lease SpeedConnect Sprint B064 Map BRS BTA064 - Butte, MT H3
New Lease SpeedConnect Sprint B144 Map BRS BTA144 - Flagstaff, AZ BRS1
New Lease SpeedConnect Sprint B144 Map BRS BTA144 - Flagstaff, AZ E4
New Lease SpeedConnect Sprint B144 Map BRS BTA144 - Flagstaff, AZ F4
New Lease SpeedConnect Sprint B167 Map BRS BTA167 - Grand Island-Kearney, NE BRS1
New Lease SpeedConnect Sprint B171 Map BRS BTA171 - Great Falls, MT BRS2
New Lease SpeedConnect Sprint B171 Map BRS BTA171 - Great Falls, MT E1
New Lease SpeedConnect Sprint B171 Map BRS BTA171 - Great Falls, MT E2
New Lease SpeedConnect Sprint B171 Map BRS BTA171 - Great Falls, MT E3
New Lease SpeedConnect Sprint B171 Map BRS BTA171 - Great Falls, MT E4
New Lease SpeedConnect Sprint B171 Map BRS BTA171 - Great Falls, MT F1
New Lease SpeedConnect Sprint B171 Map BRS BTA171 - Great Falls, MT F4
New Lease SpeedConnect Sprint B202 Map BRS BTA202 - Idaho Falls, ID BRS1
New Lease SpeedConnect Sprint B202 Map BRS BTA202 - Idaho Falls, ID BRS2
New Lease SpeedConnect Sprint B202 Map BRS BTA202 - Idaho Falls, ID E4
New Lease SpeedConnect Sprint B202 Map BRS BTA202 - Idaho Falls, ID F4
New Lease SpeedConnect Sprint B205 Map BRS BTA205 - Iowa City, IA BRS1
New Lease SpeedConnect Sprint B205 Map BRS BTA205 - Iowa City, IA BRS2
New Lease SpeedConnect Sprint B205 Map BRS BTA205 - Iowa City, IA E4
New Lease SpeedConnect Sprint B205 Map BRS BTA205 - Iowa City, IA F4
New Lease SpeedConnect Sprint B300 Map BRS BTA300 - Missoula, MT BRS1
New Lease SpeedConnect Sprint B353 Map BRS BTA353 - Pocatello, ID BRS1
New Lease SpeedConnect Sprint B353 Map BRS BTA353 - Pocatello, ID BRS2
New Lease SpeedConnect Sprint B353 Map BRS BTA353 - Pocatello, ID E4
New Lease SpeedConnect Sprint B353 Map BRS BTA353 - Pocatello, ID F4
New Lease SpeedConnect Sprint B422 Map BRS BTA422 - Sioux Falls, SD BRS1
New Lease SpeedConnect Sprint B422 Map BRS BTA422 - Sioux Falls, SD BRS2
New Lease SpeedConnect Sprint B422 Map BRS BTA422 - Sioux Falls, SD E4
New Lease SpeedConnect Sprint B422 Map BRS BTA422 - Sioux Falls, SD F4
New Lease SpeedConnect Sprint B451 Map BRS BTA451 - Twin Falls, ID BRS1
New Lease SpeedConnect Sprint B451 Map BRS BTA451 - Twin Falls, ID E4
New Lease SpeedConnect Sprint B451 Map BRS BTA451 - Twin Falls, ID F4
New Lease SpeedConnect Sprint WFY431 Map BRS P00089 - P35 GSA,40-43-38 N,99-7-41.3 W BRS1
New Lease SpeedConnect Sprint WFY595 Map BRS P03002 - P35 GSA,41-32-48.1 N,90-27-56.5 W BRS1
New Lease SpeedConnect Sprint WGW275 Map BRS P03471 - P35 GSA,43-28-24.1 N,83-50-39.9 W E4
New Lease SpeedConnect Sprint WHI959 Map BRS P00168 - P35 GSA,43-59-30.9 N,96-46-11.2 W F4
New Lease SpeedConnect Sprint WHT588 Map BRS P03685 - P35 GSA,41-31-58.1 N,90-34-40.5 W E4
New Lease SpeedConnect Sprint WLK328 Map BRS P01359 - P35 GSA,43-14-38 N,97-22-39.2 W F4
New Lease SpeedConnect Sprint WLK384 Map BRS P01362 - P35 GSA,43-14-38 N,97-22-39.2 W E4
New Lease SpeedConnect Sprint WLW827 Map BRS P01384 - P35 GSA,31-25-16.6 N,100-32-37.3 W F1234
New Lease SpeedConnect Sprint WLW894 Map BRS P01898 - P35 GSA,41-31-58.1 N,90-34-40.5 W F4
New Lease SpeedConnect Sprint WMH800 Map BRS P02690 - P35 GSA,34-13-58.1 N,112-22-15.6 W E4
New Lease SpeedConnect Sprint WMI345 Map BRS P01925 - P35 GSA,41-54-33 N,91-39-17.6 W E4
New Lease SpeedConnect Sprint WMI827 Map BRS P02939 - P35 GSA,34-42-17.1 N,112-6-57.6 W E4
New Lease SpeedConnect Sprint WMI864 Map BRS P02941 - P35 GSA,34-42-17.1 N,112-6-57.6 W F4
New Lease SpeedConnect Sprint WML478 Map BRS P03544 - P35 GSA,31-25-16.6 N,100-32-37.3 W BRS1
New Lease SpeedConnect Sprint WMX344 Map BRS P03719 - P35 GSA,43-30-10.9 N,96-34-39.2 W F4
New Lease SpeedConnect Sprint WMX358 Map BRS P01947 - P35 GSA,43-30-10.9 N,96-34-39.2 W E4
New Lease SpeedConnect Sprint WMX656 Map EBS P00155 - P35 GSA,42-43-54 N,114-25-7 W D1234
New Lease SpeedConnect Sprint WMX678 Map EBS P00017 - P35 GSA,42-43-54 N,114-25-7 W C1234
New Lease SpeedConnect Sprint WMX908 Map BRS P03551 - P35 GSA,31-25-16.6 N,100-32-37.3 W E1234
New Lease SpeedConnect Sprint WNTC543 Map BRS P01566 - P35 GSA,31-25-16.6 N,100-32-37.3 W H1
New Lease SpeedConnect Sprint WNTC543 Map BRS P01566 - P35 GSA,31-25-16.6 N,100-32-37.3 W H2
New Lease SpeedConnect Sprint WQLW472 Map BRS BTA070 - Cedar Rapids, IA BRS2
New Lease SpeedConnect Sprint WQLW472 Map BRS BTA070 - Cedar Rapids, IA E4
New Lease SpeedConnect Sprint WQLW472 Map BRS BTA070 - Cedar Rapids, IA F4
New Lease SpeedConnect Sprint WQLW474 Map BRS BTA105 - Davenport, IA-Moline, IL BRS2
New Lease SpeedConnect Sprint WLW970 Map BRS P02673 - P35 GSA,35-14-2 N,111-36-27.6 W F4
New Lease SpeedConnect Sprint WMI320 Map BRS P02694 - P35 GSA,35-14-29 N,111-36-37.6 W E4
New Lease SpeedConnect Sprint B011 Map BRS BTA011 - Alpena, MI BRS1
New Lease SpeedConnect Sprint B011 Map BRS BTA011 - Alpena, MI E4
New Lease SpeedConnect Sprint B011 Map BRS BTA011 - Alpena, MI F1
New Lease SpeedConnect Sprint B011 Map BRS BTA011 - Alpena, MI F2
New Lease SpeedConnect Sprint B011 Map BRS BTA011 - Alpena, MI F3
New Lease SpeedConnect Sprint B011 Map BRS BTA011 - Alpena, MI F4
New Lease SpeedConnect Sprint B011 Map BRS BTA011 - Alpena, MI H1
New Lease SpeedConnect Sprint B011 Map BRS BTA011 - Alpena, MI H2
New Lease SpeedConnect Sprint B011 Map BRS BTA011 - Alpena, MI H3
New Lease SpeedConnect Sprint B307 Map BRS BTA307 - Mt. Pleasant, MI E4
New Lease SpeedConnect Sprint B307 Map BRS BTA307 - Mt. Pleasant, MI F4
New Lease SpeedConnect Sprint B390 Map BRS BTA390 - Saginaw-Bay City, MI E4
New Lease SpeedConnect Sprint B390 Map BRS BTA390 - Saginaw-Bay City, MI F4
New Lease T-Mobile RigNet WPWV330 700MHz CMA306 - Gulf of Mexico C

Visualize 600MHz Reserved Spectrum Thu, Sep 07, 2017

With the September 2017 release of our Mobile Carrier - Spectrum Ownership Analysis Tool, we have also added the ability to visualize and track the 600MHz reserved spectrum by county or by market.

In our Spectrum Grid default view, you are able to visualize which spectrum blocks are designated as reserved for the counties in each of the most populated Cellular Market Area (CMA) markets.


To display the reserved spectrum for all of the counties within a Partial Economic Area (PEA) market, you can sort the county data using the PEA # column.


What portion of the US Population can Dish reach with its License Portfolio? Tue, Sep 05, 2017

With the September 2017 release of our Mobile Carrier - Spectrum Ownership Analysis Tool, we have added three new charts that provide insights into the US Population that each carrier can serve with each channel in their wireless spectrum portfolio, each frequency band, and each band classification.

Licensed POPs by Channel:

With our Mobile Carrier - Spectrum Ownership Analysis Tool, you can analyze over 1900 carriers and spectrum holders in a similar fashion to our Dish analysis. In the chart below, we examine the population that Dish could serve with each of the channels in their license portfolio.  For example, Dish's 700MHz E Block spectrum reaches nearly 250 million people while their AWS3 A1 Block reaches 300 million people.


Licensed POPs by Frequency Band:

This chart shows the cumulative population that can be served by all of a carrier's channels in a frequency band.  Where the Licensed POPs by channel chart shows the population served by each of Dish's 600MHz channels; none of which serve more than 200 million people; with Dish's overall 600MHz spectrum, they can reach nearly the total 322 million US population.

Licensed POPs by Band Classification:

This chart shows the cumulative population that can be served by all of a carrier's low-band, mid-band, or high-band spectrum.  This is an important perspective when you consider low-band spectrum being a traditional coverage layer with mid-band spectrum being traditionally a capacity layer.  Dish's current spectrum portfolio provides them with the ability to serve the entire US population both with coverage spectrum and capacity spectrum.


Dish's AWS-3 Licenses - Back in Play Thu, Aug 31, 2017

 Last week the US Court of Appeals  determined that the Dish had too much control of its affiliates (Northstar Wireless and SNR Wireless) and the FCC acted properly by denying both affiliates their combined $3.3 Billion in bidding credits which ultimately lead to Northstar and SNR giving back many of their AWS-3.    In Dish's favor, the court determined that the FCC needed to provide Northstar and SNR with the opportunity to revise their contracts with Dish to comply with the issue of control.    This opens the opportunity for Dish to regain some of the AWS-3 licenses they collectively won at the auction.  Below we have listed the licenses and channels that Northstar and SNR each returned to the FCC.


Comparing the Millimeter Wave Deals Fri, Jun 23, 2017

Yesterday Allnet Insights & Analytics presented at the Wells Fargo 5G forum.  Below are several of the slides that describe the millimeter wave spectrum holdings for each of the parties involved in the current millimeter wave deals. Each of these slides is a direct analysis output from our Millimeter Wave - Spectrum Ownership Analysis Tool.  In these slides we have selected 8 carriers from the 173 carriers available in the tool. The first slide compares the National Weighted Average spectrum depth for each of the carriers.  Verizon's spectrum position is displayed as NextLink Wireless since Verizon at the time this slide was created was only leasing NextLink's spectrum.  In this set of slides we also highlight the risk surrounding the FiberTower transaction for AT&T.  The largest portion of the FiberTower transaction is for licenses that the FCC has terminated.  It is unknown how many of these licenses will be restored and added to AT&T's spectrum holdings.

 While the National Average slide highlights how much spectrum each carrier has on average across the county, networks are deployed using the available spectrum within a market.  The slides below highlight the amount of spectrum that each carrier has in a CMA (Cellular Market Area).  The Top 5 markets are in the first slide including Los Angeles, New York, Chicago, Dallas and Houston.

 The remaining Top 10 markets are in the second slide: Philadelphia, Washington D.C., Detroit, Atlanta, and Boston. 

 The last slide highlights the estimated MHz-POPs for each of the carriers for their Millimeter Wave spectrum.  It is worth noting that the ranges for Mobile Carrier spectrum (600MHz-2.5GHz) for the National Carriers is 30B MHz-POPs to 65B MHz-POPs.  On this chart, the lowest range is 50B MHz-POPs.


Spectrum Trades - Highlighting Market Spectrum Changes Fri, Mar 10, 2017

In my most recent post on the filed FCC Transactions for February 2017 there were over 275 call signs that were assigned to new licensees and nearly 100 call signs that were leased.  In an industry driven by spectrum, these changes affect the operations for every wireless carrier, they change site interference, and they affect the channels that are programmed into private repeaters and DAS systems.

So how can your company stay on top of the changes that may affect your markets.  Allnet Insights' publishes a National Carrier Spectrum Depth Report which details the spectrum held by Verizon, AT&T, T-Mobile, Sprint, Dish, and USCellular in the Top 100 Cellular Market Areas (CMA).  We report both the spectrum that each carrier currently holds (Current Holdings) and the spectrum they will hold in the future (Future Holdings) based on pending FCC transactions.  Reporting on both current and future holdings enables Allnet Insights' to also report on the changes between current and future holdings which highlight the location and quantity of spectrum that is changing hands.

Below is a screenshot of the 11th through the 25th most populated CMA markets in our February 2017 report.  This highlights the markets where the national carriers are either increasing or decreasing their spectrum holdings.  In the Excel report you can reveal specific holdings by frequency bands that are changing but for this post, we will stay with the total spectrum view.   From this view, you can see that in San Diego, T-Mobile is increasing their held spectrum by 5MHz while AT&T is decreasing their held spectrum by 5MHz.  The reverse is happening in the Sacramento CMA.

We also highlight the spectrum that is changing hands in our Web Spectrum Viewer.  In the Spectrum Grid menu, we lower case the 3 letter carrier code to indicate that the carrier ownership is changing from the current to the future.  Looking at the same San Diego market (San Diego County) you can see (tmo) on the PCS B6 spectrum.  Since this screen shot is of the Future Holdings, T-Mobile is will control this spectrum in the future.   

Future:

The screen shot below is of the San Diego County Current Holdings. (att) in the PCS B6 column indicates that AT&T is the current operator of the B6 channel. 

Current:

For Sacramento (Placer, Sacramento, and Yolo Counties), we can see that AT&T will be the future operator of the PCS B11 channel and that T-Mobile will be the carrier giving up the PCS B11 channel. 

Future:

Current:

 My last example is in Tucson, AZ.  From the National Carriers Report we can see that T-Mobile is increasing their held spectrum by 10MHz.   

From the Web Spectrum Viewer, it is clear that T-Mobile is receiving the PCS A10 and A11 channels from Commnet (cmm).

Future:

Current: 


FCC Spectrum Transactions - February 2017 Mon, Mar 06, 2017

Today, we have released Allnet's Insights' March 2017 Mobile Carrier - Spectrum Ownership Analysis Tool.  Below are the transactions that have been updated by the FCC from February 1st to February 28th and are included in our update. 

The details for all of the below transactions are available by subscribing to Allnet Insights' Web Tool - Basic Module.  Our Web Tool provides spectrum transaction detail, a spectrum grid of spectrum owners at a county level, and spectrum database covering all mobile carrier frequencies from 600MHz to 2.5 GHz.

Granted Assignments (Assigning Ownership from Assignor to Assignee):

Granted Leases (Leased to Assignee from Assignor):

New Pending Assignments (Assigning Ownership from Assignor to Assignee):

Pending Leases (Leased to Assignee from Assignor):


Dish 5G Spectrum from Echostar Thu, Feb 02, 2017


FCC Spectrum Transactions - December 2016 Thu, Jan 05, 2017

Today, we have released Allnet's Insights' January 2017 Mobile Carrier - Spectrum Ownership Analysis Tool.  Below are the transactions that have been updated by the FCC from December 1 to December 31 and are included in our update. 

The details for all of the below transactions are available by subscribing to Allnet Insights' Web Tool - Basic Module.  Our Web Tool provides spectrum transaction detail, a spectrum grid of spectrum owners at a county level, and spectrum database covering all mobile carrier frequencies from 700MHz to 2.5 GHz.

Granted Assignments (Assigning Ownership from Assignor to Assignee):

Granted Leases (Leased to Assignee from Assignor):

New Pending Assignments (Assigning Ownership from Assignor to Assignee):

Pending Leases (Leased to Assignee from Assignor):


my wishlist