Spectrum Blog

How Much Bandwidth Will AST SpaceMobile Actuall...
As the wireless industry continues to propose and expand on plans to provide Supplemental Coverage from Space (SCS) we thought it would be helpful to look at how the spectrum...
How Much Bandwidth Will AST SpaceMobile Actuall...
As the wireless industry continues to propose and expand on plans to provide Supplemental Coverage from Space (SCS) we thought it would be helpful to look at how the spectrum...

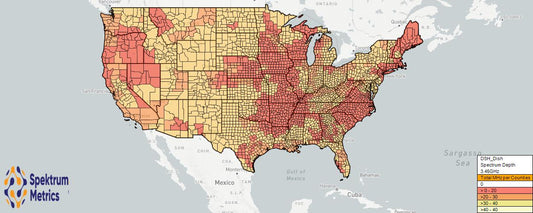
Beyond the Megahertz: Analyzing AT&T's Leap to ...
AT&T has accumulated a majority of the 3.45GHz spectrum in many markets through their proposed acquisitions from Soniqwave, USCellular and EchoStar (Dish). How have these acquisitions affected the maximum NR...
Beyond the Megahertz: Analyzing AT&T's Leap to ...
AT&T has accumulated a majority of the 3.45GHz spectrum in many markets through their proposed acquisitions from Soniqwave, USCellular and EchoStar (Dish). How have these acquisitions affected the maximum NR...

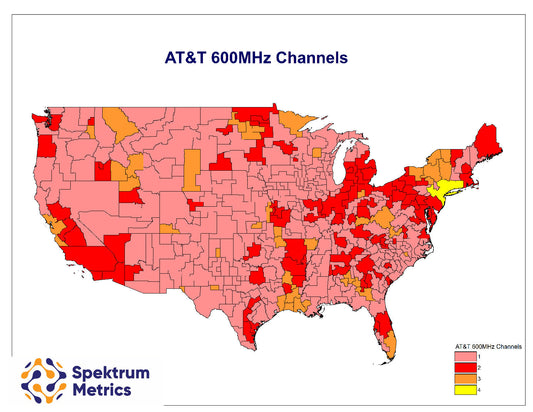
The 100 MHz Club: Markets Where AT&T's Low-Band...
AT&T's acquisition of Echostar/Dish's 600MHz spectrum provides it with an opportunity to begin to close the 5G coverage/capacity gap with T-Mobile. For this post we are going to focus our...
The 100 MHz Club: Markets Where AT&T's Low-Band...
AT&T's acquisition of Echostar/Dish's 600MHz spectrum provides it with an opportunity to begin to close the 5G coverage/capacity gap with T-Mobile. For this post we are going to focus our...
Strategic Decisions: When Spectrum Deals Emerge
Last week highlighted the importance of having access to a spectrum database and analysis tool that is capable of modeling announced transactions. There were several things that our customers were...
Strategic Decisions: When Spectrum Deals Emerge
Last week highlighted the importance of having access to a spectrum database and analysis tool that is capable of modeling announced transactions. There were several things that our customers were...
Comparing AT&T and T-Mobile's 600MHz Spectrum T...
Previously we looked at the the effect of the AT&T / Echostar deal to determine the remaining 600MHz channels that would not already be committed to AT&T or T-Mobile. In...
Comparing AT&T and T-Mobile's 600MHz Spectrum T...
Previously we looked at the the effect of the AT&T / Echostar deal to determine the remaining 600MHz channels that would not already be committed to AT&T or T-Mobile. In...
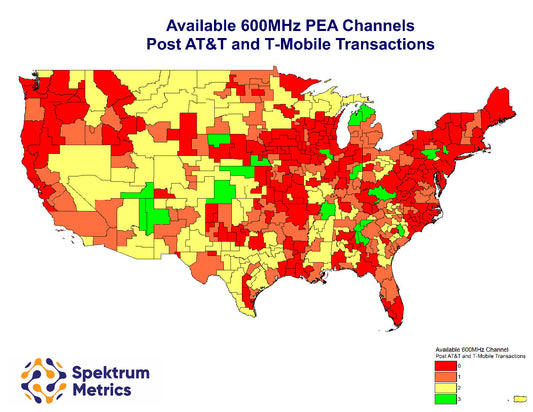
How Many 600MHz Channels Remain Available in Ea...
With AT&T's announced purchase of Echostar's 600MHz spectrum our first investigative blog post will evaluate the remaining channels of spectrum that are not controlled by AT&T or T-Mobile. In later...
How Many 600MHz Channels Remain Available in Ea...
With AT&T's announced purchase of Echostar's 600MHz spectrum our first investigative blog post will evaluate the remaining channels of spectrum that are not controlled by AT&T or T-Mobile. In later...