Spectrum Blog
Filter by
Tags ×
- 12.2GHz
- 1800MHz
- 2.5
- 2.5GHz
- 2100MHz
- 2300MHz
- 24GHz
- 2500MHz
- 28GHz
- 3.3GHz
- 3.45GHz
- 3.5GHz
- 31GHz
- 3500MHz
- 37GHz
- 39GHz
- 3GPP
- 47GHz
- 5G
- 600MHz
- 700MHz
- 800MHz
- 900MHz
- Agri-Valley Communication
- AllNet Labs
- AST SpaceMobile
- AT&T
- ATNI
- ATT
- Auction
- Auction 105
- Auction 108
- Auction 110
- AWS
- AWS-3
- AWS2
- AWS3
- AWS4
- AWS5
- Axtel
- Band 38
- Band 41
- Band Class
- Bell Mobile
- Bell Mobility
- Bharti Airtel
- Blackrock
- Blue Ridge Wireless
- BNSL
- Bragg
- Broadband Incentive
- BRS
- BTA
- C Spire
- C-band
- CableOne
- Canada
- Carrier Aggregation
- Cass Cable
- Cavalier
- CBRS
- CBS
- Cellular
- Channel 51
- Channel Block
- Charter
- China Mobile
- Claro
- Clearwire
- Cogeco
- Columbia Capital
- Comcast
- Cox
- Cross Wireless
- Cypress
- Data
- DISH
- Dish Anywhere
- Duono
- Eastlink Wireless
- EBS
- EBS Auction
- Echostar
- EMBMS
- Ericsson
- FCC
- FDD-LTE
- FiberTower
- FirstNet
- Freedom
- Geneseo Communications
- GLG
- Globalstar
- Go Long Wireless
- Grain
- GSA
- Hawaii
- IFT
- Iowa Wireless
- Iris
- LAA
- Leap
- Liberty
- Licensed POPs
- LMDS
- LTE
- LTE Advance
- LTE Band
- LTE Band Class
- LTE Broadcast
- M&M Brothers
- MBS
- MetroPCS
- Mexico
- MHz-POPS
- Michigan Wireless
- Millimeter Wave
- MIMO
- MVDDS
- MVNO
- NextLink
- NFL
- Northstar
- NR
- NR Band Analysis
- Off-loading
- Orion Wireless
- PAL
- PCS
- PCS G
- PCS H
- Plateau Telecommunications
- PSA
- Qualcomm
- RCR
- Red Mayorista
- Reliance Jio
- Remapping
- Rogers
- RRH
- RSA Access
- Rulemaking
- Sagebrush Cellular
- SAS
- Sasktel
- Shenandoah
- Skyriver
- Small Cell
- Small Cells
- SNR
- Softbank
- Soniqwave
- SpaceX
- Spectrum
- Spectrum Ownership Analysis Tool
- Spectrum Ownership Mapping
- Spectrum Screen
- Spectrum Transactions
- SpectrumCo
- Sprint
- SSI Micro
- Starry
- Straight Path
- Supplemental Coverage from Space
- T-Mobile
- TBayTel
- TDD-LTE
- Telcel
- Telefonica
- Telmex
- Telus
- Terrestar
- TLPS
- Tribal
- TV Zac
- Ultravision
- United States
- Upper Microwave
- Usage
- USCellular
- Verizon
- Videotron
- Vodafone Idea
- VOIP
- VoLTE
- WCS
- Web Spectrum Viewer
- White Space
- Whitespace
- WiFi
- Xplore
- Xplornet
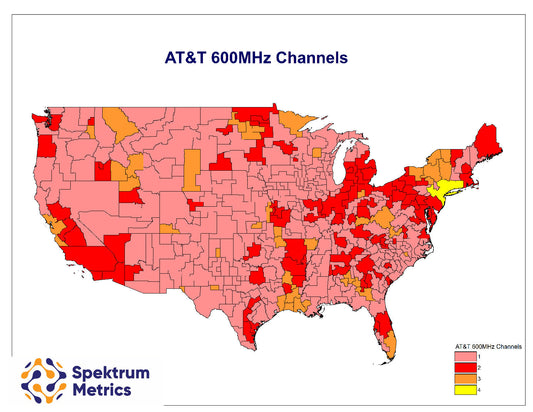
Comparing AT&T and T-Mobile's 600MHz Spectrum T...
Previously we looked at the the effect of the AT&T / Echostar deal to determine the remaining 600MHz channels that would not already be committed to AT&T or T-Mobile. In...
Comparing AT&T and T-Mobile's 600MHz Spectrum T...
Previously we looked at the the effect of the AT&T / Echostar deal to determine the remaining 600MHz channels that would not already be committed to AT&T or T-Mobile. In...
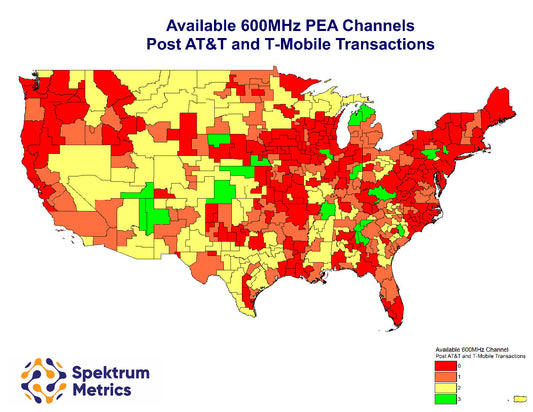
How Many 600MHz Channels Remain Available in Ea...
With AT&T's announced purchase of Echostar's 600MHz spectrum our first investigative blog post will evaluate the remaining channels of spectrum that are not controlled by AT&T or T-Mobile. In later...
How Many 600MHz Channels Remain Available in Ea...
With AT&T's announced purchase of Echostar's 600MHz spectrum our first investigative blog post will evaluate the remaining channels of spectrum that are not controlled by AT&T or T-Mobile. In later...
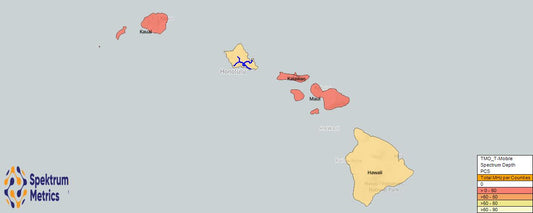
T-Mobile's Spectrum Deal: Did It Happen?
Over 18 months ago, in the lead up to Auction 108, we wrote about a T-Mobile agreement to reduce their spectrum holdings in Hawaii to resolve a concern about their...
T-Mobile's Spectrum Deal: Did It Happen?
Over 18 months ago, in the lead up to Auction 108, we wrote about a T-Mobile agreement to reduce their spectrum holdings in Hawaii to resolve a concern about their...
US Cellular: What Spectrum Remains?
Below is a broad overview of the spectrum assets USCellular held prior to offering its self for sale (in MHzPOPs) and how those assets have been distributed through acquiring carrier...
US Cellular: What Spectrum Remains?
Below is a broad overview of the spectrum assets USCellular held prior to offering its self for sale (in MHzPOPs) and how those assets have been distributed through acquiring carrier...
Changes in the 28 GHz Landscape
In late November, Mike Dano highlighted that T-Mobile had cancelled over 500 millimeter wave licenses where they didn't want to meet the buildout obligations. Upon investigating the cancelled licenses...
Changes in the 28 GHz Landscape
In late November, Mike Dano highlighted that T-Mobile had cancelled over 500 millimeter wave licenses where they didn't want to meet the buildout obligations. Upon investigating the cancelled licenses...
Interference to PCS Channels from SpaceX
On August 16th, AT&T filed a petition to deny SpaceX's waiver request that would allow SpaceX to operate from space on T-Mobile's PCS G channels. From the Web Spectrum Viewer...
Interference to PCS Channels from SpaceX
On August 16th, AT&T filed a petition to deny SpaceX's waiver request that would allow SpaceX to operate from space on T-Mobile's PCS G channels. From the Web Spectrum Viewer...