Spectrum Blog

Mexico’s Spectrum Allocation: Strategy and Comp...
At Spektrum Metrics, we deliver clear, technical, and actionable spectrum ownership insights to support wireless planning across global markets. We’ve added Mexico to our portfolio of international capabilities, joining the...
Mexico’s Spectrum Allocation: Strategy and Comp...
At Spektrum Metrics, we deliver clear, technical, and actionable spectrum ownership insights to support wireless planning across global markets. We’ve added Mexico to our portfolio of international capabilities, joining the...
Strategic Decisions: When Spectrum Deals Emerge
Last week highlighted the importance of having access to a spectrum database and analysis tool that is capable of modeling announced transactions. There were several things that our customers were...
Strategic Decisions: When Spectrum Deals Emerge
Last week highlighted the importance of having access to a spectrum database and analysis tool that is capable of modeling announced transactions. There were several things that our customers were...
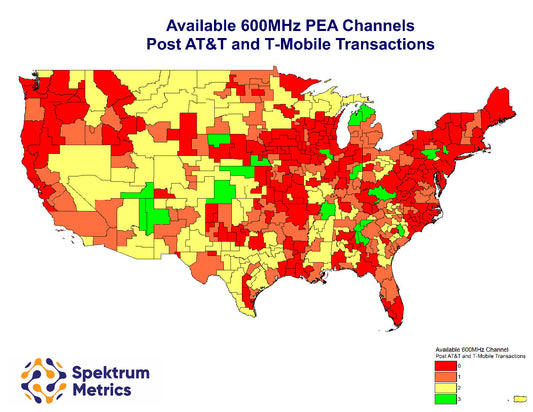
Comparing AT&T and T-Mobile's 600MHz Spectrum T...
Previously we looked at the the effect of the AT&T / Echostar deal to determine the remaining 600MHz channels that would not already be committed to AT&T or T-Mobile. In...
Comparing AT&T and T-Mobile's 600MHz Spectrum T...
Previously we looked at the the effect of the AT&T / Echostar deal to determine the remaining 600MHz channels that would not already be committed to AT&T or T-Mobile. In...
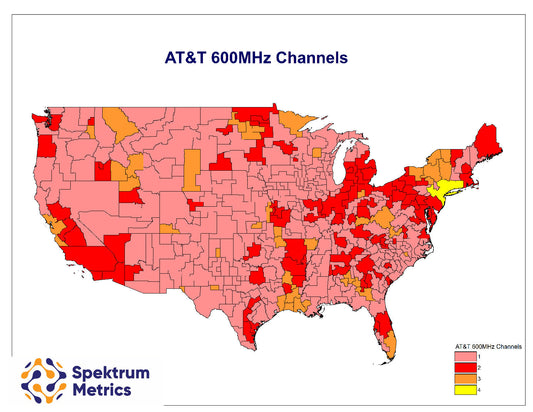
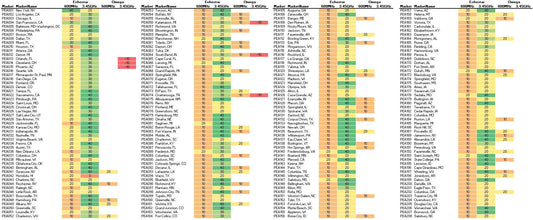
How Many 600MHz Channels Remain Available in Ea...
With AT&T's announced purchase of Echostar's 600MHz spectrum our first investigative blog post will evaluate the remaining channels of spectrum that are not controlled by AT&T or T-Mobile. In later...
How Many 600MHz Channels Remain Available in Ea...
With AT&T's announced purchase of Echostar's 600MHz spectrum our first investigative blog post will evaluate the remaining channels of spectrum that are not controlled by AT&T or T-Mobile. In later...
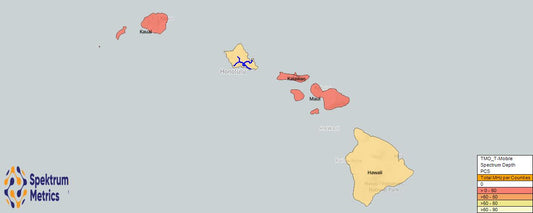
T-Mobile's Spectrum Deal: Did It Happen?
Over 18 months ago, in the lead up to Auction 108, we wrote about a T-Mobile agreement to reduce their spectrum holdings in Hawaii to resolve a concern about their...
T-Mobile's Spectrum Deal: Did It Happen?
Over 18 months ago, in the lead up to Auction 108, we wrote about a T-Mobile agreement to reduce their spectrum holdings in Hawaii to resolve a concern about their...
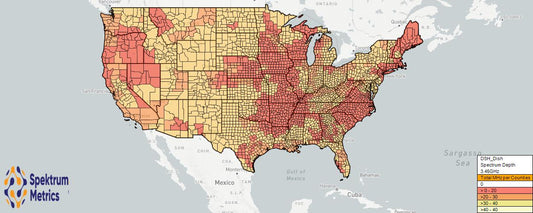
Echostar and AT&T - Spectrum Depth in Every Market
AT&T's press release indicated "AT&T will acquire approximately 30 MHz of nationwide 3.45 GHz mid-band spectrum and approximately 20 MHz of nationwide 600 MHz low-band spectrum for approximately $23 billion...
Echostar and AT&T - Spectrum Depth in Every Market
AT&T's press release indicated "AT&T will acquire approximately 30 MHz of nationwide 3.45 GHz mid-band spectrum and approximately 20 MHz of nationwide 600 MHz low-band spectrum for approximately $23 billion...