${{amount}} USD

my cart

Free Shipping On world wide

  • HOME
  • PRODUCTS
  • IN THE NEWS
  • SPECTRUM BLOG
  • WEB SPECTRUM VIEWER

Spectrum Blog

Why is T-Mobile Giving Up Spectrum in Hawaii? Tue, Mar 05, 2024

T-Mobile made commitments to the FCC in the Memorandum Opinion and Order in their application for their Auction 108 (2.5 GHz Band Licenses).  T-Mobile committed to divest by sale or swap, 20 MHz of spectrum in the AWS-1, AWS3, PCS, or 2.5GHz bands.  The spectrum sold will be no smaller than 10 MHz blocks of TDD spectrum or 5x5 MHz blocks of FDD (paired) spectrum.  T-Mobile has twelve months to file the transfer applications.

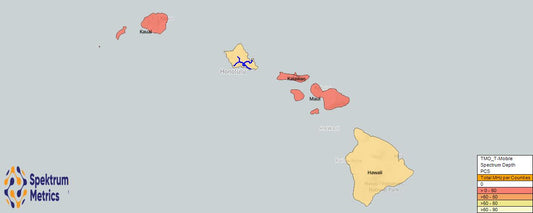
The FCC specifically called out two CMA markets where T-Mobile will need to divest spectrum:  CMA385 - Kauai and CMA386 - Maui.  Although T-Mobile's held spectrum in Hawaii doesn't stand out compared to other markets in the US, the issue with the spectrum screen in Hawaii is that 3.45 GHz spectrum (100 MHz) and C-band spectrum (280 MHz) are not available.  This reduces the available spectrum by almost 400 MHz, thus reducing the spectrum screen by potentially 126 MHz. 


In the above map, the CMA markets in Hawaii are indicated.  To see how each carriers spectrum totals up in each of these markets we will utilize our Web Spectrum Viewer - Spectrum Depth Module.  First we have exported the county spectrum totals by band classification.  Kalawao and Maui county make up CMA 386 and Kauai county makes up CMA385.  The bottom 3 counties in the chart below represent the counties where T-Mobile needs to divest 20 MHz of spectrum.  

Reviewing the data, it is clear that T-Mobile's lower mid-band spectrum and upper mid-band spectrum are the two areas where T-Mobile has a sizable advantage.  I assume that EBS/BRS spectrum is off the table from T-Mobile's perspective and it would be difficult to sell that band due to T-Mobile's nationwide "exclusive" use.

Looking then at the lower mid-band spectrum, T-Mobile's held spectrum in both the AWS-1 and AWS-3 bands is pretty similar with Verizon and AT&T. 

I will also note that if T-Mobile was to give up any of their AWS-1/AWS-3 spectrum holdings they would drop below their desired 20MHz channel in NR band 66.

There are two considerations for T-Mobile's PCS spectrum.  First, T-Mobile controls two blocks of spectrum in all of the Hawaii counties, 15 MHz at the bottom of the band and 20 MHz at the top.  I believe that T-Mobile's agreement with SpaceX utilizes the PCS G channels at the top of the PCS band, so I think the upper block will be retained.  In a perfect world, T-Mobile would sell a 10x10 slice (A8-A11) of their lower block of spectrum to Verizon and swap their A6-A7 spectrum with Verizon for Verizon's F1-F2 spectrum.  In this scenario, Verizon would increase their channel size in two of these counties from 10/10 to 20/20 and in Kauai they would have 25/25.  T-Mobile would then have all of their spectrum together and could have a NR band 25 - 20MHz channel and a dedicated 5 MHz channel for SpaceX.

Add your thoughts to our LinkedIn post or the post on X.


Evaluating Spectrum Screens by Band Classifications Tue, Oct 24, 2023

Recently the FCC opened a comment period regarding an AT&T petition to establish a mid-band spectrum screen. I thought this would be a good opportunity to look at the spectrum screen components by band classification.
In the table below, we demonstrate how each of the Spectrum Screen values for Spektrum Metrics and the FCC roll up into each of the band classifications.  As a reminder, Low Band spectrum is good for coverage, Lower Midband spectrum balances bandwidth with coverage, and Upper Midband spectrum emphasizes bandwidth with less coverage that Lower Midband spectrum. 
In the far right column, we indicate what the FCC spectrum screen component would be for that particular band.  The historical FCC guideline has been to establish a spectrum screen at 1/3 of the total allotted spectrum.
  
To evaluate each carrier's Spectrum Screen with these band classifications, we updated the Spectrum Screen modules in our Spectrum Ownership Analysis Tool to detail the Spectrum Screen values  for each county and each Cellular Market Area (CMA).
 
County Spectrum Screen:
 
CMA Market Spectrum Screen:
 
In the following 3 charts, we highlight each of the national carrier's Spectrum Screen values for the Top 50 CMA markets by band classification.  You can visualize where the inputted FCC spectrum screen value from the table above would lie relative to each carrier's market values.
 
Low Band Spectrum Screen:
 
Lower Midband Spectrum Screen:
 
Upper Midband Spectrum Screen:

Market Spectrum Screens for the US National Carriers Wed, Oct 11, 2023

The recent news highlighting a FCC proceeding into the spectrum screen referenced, some analysis by Raymond James establishing T-Mobile dominance with 350MHz of spectrum on average in the nation's top markets.

To see how that plays out on a market by market basis, I am going to use the spectrum screen analysis data from Spektrum Metric's Spectrum Ownership Analysis Tool which details the spectrum that applies to the screen for all of the US counties or for all of the US Cellular Market Areas (CMA).  The chart below is for the Top 49 CMA markets by population (2021 estimated population). The markets are sorted from highest population on the left to the lowest population on the right. I have eliminated San Juan, PR because the national carrier's don't have a consistent investment strategy for many of the US territories including Puerto Rico.


3.45GHz Auction Results Sat, Jan 15, 2022

On Friday, the FCC posted the results from Auction 110.  On Saturday we updated the January 2021 release of our Mobile Carrier - Spectrum Ownership Analysis Tool to reflect the auction results.  These results provide the most detailed view of each carrier's spectrum that can be deployed for 5G, particularly all of the available upper mid-band spectrum including EBS/BRS, 3.45GHz, CBRS, and C-band.

In the Spectrum Grid, we can see the channel allocations.  In general, Dish took the upper end of the band with T-Mobile and AT&T alternate having the lower parts of the band.  In many markets, AT&T is pinned in the middle of the band between T-Mobile, Grain, and Columbia Capital.  Each of the spectrum investors has selected spectrum assignments adjacent to AT&T's spectrum meaning they are each well positioned to sell to AT&T if the 3.45GHz spectrum cap is lifted. 

In the National Band Ownership slides we look at each carrier's ownership based upon the percent of MHz-POPs that they control.

For the 3.45GHz band, AT&T leads the way with 39% of the MHz-POPs, Dish has 30%, T-Mobile has 12%, and USCellular has 4%.  

Looking the the complete picture for Upper Mid-band spectrum, T-Mobile still leads with 34%, Verizon follows with 30%, then AT&T with 24%.  Dish has 9% of the upper mid-band MHz-POPs and USCellular has 2%.


C-band Interim and Future Licenses Thu, Aug 12, 2021

On July 23rd, the FCC granted most of the C-band (Auction 107) licenses. This provided us the first opportunity to see how the FCC was going to handle the interim A block licenses that will transition into the permanent license on December 31, 2023.  The FCC provided call signs for each of the permanent licenses as well as call signs for each of AT&T's interim licenses.

These interim and future designations allow us to highlight a unique capability of our Web Spectrum Viewer and Mobile Carrier - Spectrum Ownership Analysis Tool.   For each block of spectrum we capture the spectrum licensee and the carrier that may lease the spectrum.  This information indicates the current operator.  Typically the current operator is the future operator, unless a pending transaction allocates that spectrum block to a different operator.  We are using this database capability to reflect the interim C-band licenses with the current operator field and the permanent operator with the future operator field.  You can see the AT&T interim allocations below as we are displaying the "Current" Spectrum Ownership Grid. 

Current View:


The future allocations are seen in the Future View below.

Future View:


Another way that this current and future ownership data can be seen is in our Spectrum Survey.    The Spectrum Survey provides the call sign, current operator, and future operator for all of the frequency bands in a selected county.  

Spectrum Survey:


5G Reconfiguration in Mexico Tue, May 19, 2020

In April, El Economista highlighted a transfer of 3.5GHz spectrum in Mexico from Telmex to Telcel.  The article highlights a series of consultations between Telmex, Telcel, AT&T, and the Federal Telecommunications Institute (IFT).  I will use our Mobile Carrier - Spectrum Ownership Analysis Tool (MEX) to examine these transactions and the overall 5G spectrum plans in Mexico.

Our Spectrum Grid from December 2019, reflects the ownership of the 3.5GHz band prior to the Telcel acquisition.  At this point, Telmex, AT&T, and Axtel each owned 50MHz of spectrum (25MHz of uplink and 25MHz of downlink spectrum).  In this view we included a TDD band class 48 which is the only band class defined by 3GPP for this band.  Obviously, systems using this band configuration are not using band class 48 since they are FDD and band class 48 is TDD.

AT&T and Telmex approached the Federal Telecommunications Institute (IFT) in December to request that they exchange AT&T's D channel for Telmex's H channel, providing each carrier with 50MHz blocks of spectrum in the 3.5GHz band.  This exchange only makes sense if IFT reconfigured the entire band to TDD spectrum. 

The new configuration is reflected in the image below with Telcel acquiring Telmex's 50MHz channel.  Now Telcel and AT&T are set up with the minimum 5G channel size in one of Mexico's two TDD bands and IFT also has 150MHz of spectrum remaining for a future auction.  It is interesting to note, that both Canada and Mexico have opted for licensing spectrum directly to carriers for their 3.5GHz bands while the USA has gone with the shared spectrum and PAL licensing approach.


Assessing the COVID Temporary Spectrum Licenses Tue, Mar 31, 2020

Last week we began to see announcements from the FCC authorizing a series of temporary spectrum usage agreements to provide additional spectrum to several of the wireless operators to increase network capacity as workers are dispatched to their homes.

We will look at the effect of these agreements in a few markets to see how they are increasing LTE capacity.  The analysis will be supported with outputs from our Mobile Carrier - Spectrum Ownership Analysis Tool  specifically the Spectrum Ownership Grid.

T-Mobile 600MHz Capacity Expansion:

The first agreement provides T-Mobile with access to 600MHz spectrum from Bluewater Wireless, Channel 51 LIcense Co and LB License Co (Columbia Capital), CC Wireless Investment (Comcast), ParketB.com Wireless (Dish), New Level (Grain), and Tstar License Holdings (Tri-Star).

In the image below for the New York CMA market, T-Mobile will have access to Comcast's spectrum (XFI) and Dish's spectrum increasing their 600MHz channel size in New York from 10MHz channel to a 20MHz channel.  T-Mobile would have access to the entire 35MHz of spectrum so they could provide a 20MHz channel and a 10MHz channel for capacity.   Because T-Mobile has already deployed Band 71 equipment in New York, they can turn up the expanded spectrum without additional equipment installations.


USCellular AWS-3 Capacity Expansion:

The next agreement provides USCellular access to AWS-3 spectrum from their bidding partner Advantage Spectrum.  In the image below a few of the Washington markets where USCellular will access AWS-3 spectrum are indicated.  In most of these markets, USCellular currently operates on their cellular frequencies but doesn't have Band 66 operations.Thus,  USCellular will need to add base stations and antennas to their sites for Band 66 to utilize these new frequencies.  In five of these counties USCellular is likely operating on AWS-1 spectrum in Band 66 so the spectrum will be easier to deploy in those counties. 


Verizon AWS-3 Capacity Expansion:

In the image below we illustrate the AWS-3 spectrum that Verizon will gain temporary access from SNR License Co and Northstar Wireless (both Dish partners).  Northstar controls the AWS-3 G channel and SNR LIcense Co controls the AWS-3 H channel.  In the New York market, Northstar Wireless owns the G block spectrum and SNR Wireless owns the H block spectrum.  Accessing this spectrum will provide Verizon a second Band 66 LTE channel, increasing their LTE capacity from 20MHz to 30MHz.


Verizon & AT&T AWS-3 Capacity Expansion:

Verizon and AT&T have also requested access to the spectrum that Northstar Wireless and SNR Wireless returned to the FCC when their auction discounts were eliminated.  The AWS-3 spectrum depth that is "unassigned" is indicated in the map below.  In our data, we reflect these unassigned licenses with the FCC heading.


AT&T requested the I block spectrum in the New York market, so it will expand their Band 66 LTE from 10MHz to 15MHz.  The markets AT&T requested are listed here and the markets that Verizon requested are here.


AT&T AWS-4 Capacity Expansion:

AT&T has also requested access to Dish's Band 66 spectrum.  From the image above AT&T can expand their Band 66 LTE by and additional 5MHz to 20MHz by using part of Dish's AWS-4 spectrum.  AT&T will still have an additional 15MHz of Dish's spectrum that they could use as an additional LTE channel in New York.  AT&T only requested access to Dish's Band 66 spectrum, not their Band 70 AWS-4 spectrum.

AT&T 700MHz E-block Expansion:

Dish also reported that AT&T requested access the the 700MHz E-block in the markets that AT&T doesn't own.  In the image below, Dish's ownership in Chicago and Detroit will provide AT&T the capability to expand their Band 29 supplemental downlink from 5MHz to 10MHz.


Auction 103 Millimeter Wave - Spectrum Ownership Analysis Tool Update and Release Thu, Mar 12, 2020

Spektrum Metrics Insights & Analytics is pleased to announce that our Millimeter Wave - Spectrum Ownership Analysis Tool has been updated with the Auction 103 results and is available for purchase.

Below is a sample of the Spectrum Grid Analysis Module, highlighting the 37/39 GHz spectrum ownership for the New York, Los Angeles, and Chicago CMA markets.

The Millimeter Wave - Spectrum Ownership Analysis Tool contains 20 additional analysis modules including:

  • Spectrum Depth - County
  • Spectrum Depth - Company Profile
  • Spectrum Depth - NR Band Class
  • Spectrum Depth - Frequency Band
  • Spectrum Depth - Market
    • Cellular Market Area (CMA)
    • Partial Economic Area (PEA)
    • Designated Market Area (DMA)
  • Spectrum Depth - Country
  • Spectrum Depth - State
  • Spectrum Depth - Channel
  • Licensed POPs Analysis
    • By Channel
    • By Frequency Band
  • MHz-POPs Analysis
    • By Frequency Band
    • By Country
  • NR Channel Analysis 
  • Contiguous Spectrum Analysis
  • Frequency Band Ownership Analysis

With our Web Spectrum Viewer subscription, maps for each carrier's total Millimeter Wave spectrum depth and their spectrum depth for each frequency band are available.  Below is a map for the 47GHz spectrum that Sprint won in Auction 103.

Click here to contact Spektrum Metrics Insights & Analytics.


Historical Spectrum Data - A Look Back to 2012...MetroPCS, SpectrumCo, Clearwire, and Leap Wireless Mon, Jan 20, 2020

One of the benefits of Allnet Insights' Spectrum Ownership Analysis Tools, is the repository of monthly releases that we have accumulated. With the USA Mobile Carrier Tool we have monthly versions going back to July 2012.  Each of our historical tools details spectrum ownership and the variety of spectrum depth analysis modules that were supported at that time.  

I thought it would be interesting to look back at the spectrum ownership landscape from July 2012.  Looking first at our Spectrum Grid for low band spectrum, you can see that Verizon still holds the 700MHz B block licenses that were sold later to AT&T.  In addition, Verizon also holds the 700MHz A block licenses that were sold to T-Mobile.  

Looking next at the lower mid band spectrum, former licensees like SpectrumCo, Leap Wireless, and MetroPCS still control blocks of AWS-1 and PCS spectrum.  This view of spectrum ownership also allows you to see how Verizon consolidated their AWS-1 spectrum holdings with SpectrumCo's holdings into a 20 MHz block through spectrum license trades with T-Mobile and their MetroPCS licenses.  Today Verizon controls the lower 20 MHz of the AWS-1 band and T-Mobile controls the upper 25 MHz in the New York / New Jersey counties.

Looking at the upper mid band spectrum we first see all of the original WCS spectrum licensees:  Horizon Wi-Com, Nextwave, Sprint, Comcast, and San Diego Gas & Electric.  Clearwire also appears in the upper mid band Spectrum Grid with their 2.5GHz spectrum holdings.

It is interesting then to look at our County Analysis module to see the detail on each carrier's spectrum depth.  It is noteworthy to mention that Verizon has 119 MHz of spectrum in most of the New York / New Jersey counties with AT&T trailing with 91 MHz of spectrum.  Verizon still sits with rough the same amount of spectrum although they replaced all of the 700MHz spectrum they sold to AT&T and T-Mobile with SpectrumCo spectrum and AWS-3 spectrum while AT&T has growth while AT&T has grown their spectrum depth in the same counties to 161 MHz.


Mobile Carrier - Spectrum Ownership Analysis Tool Release for MEXICO Mon, Sep 30, 2019

Allnet Insights & Analytics is excited to announce an expansion of our industry leading spectrum ownership analysis products to cover the Mobile Carrier (600MHz to 3.7GHz) frequency bands for Mexico. We are releasing not only a October 2019 new release, but historical monthly releases going back to June 2016.  The Mobile Carrier Tool not only provides the spectrum allocation details for all of the Mexican Mobile Carrier spectrum but it provides 21 different analysis modules and charts to analyze and compare each wireless carrier's spectrum assets by channel, market, frequency band, band classification, and LTE band class.  Each carrier's licensed population and MHz-POPs values are included as well.

The Mexican Spectrum Grid details the current and future spectrum ownership for each municipio (county).  The municipio areas can be seen on the map below which indicates Ultravision's Broadband Radio (2.5GHz) holdings. 


Below is the Mexican Spectrum Grid for the Mobile Carrier low band spectrum.  All of the 600MHz spectrum is currently controlled by the Federal Telecommunications Institute (IPF) leading up to an early 2020 auction.


5G New Radio (NR) Band Analysis Tue, Jul 23, 2019

In July we expanded the analysis capabilities of our Mobile Carrier and Millimeter Wave - Spectrum Ownership Analysis Tools to include 5G New Radio(NR) Band Analysis for each of the 3GPP supported bandwidths in each US NR band class.

First, in the Mobile Carrier Tool, we are supporting both the uplink and downlink NR bands separately for bands that provide Frequency Division (FDD) operation.  This analysis module outputs the largest channel size (for both uplink and downlink) that a carrier could deploy in their 5G/LTE uplink carrier aggregation scheme or their downlink carrier aggregation scheme. Below in the downlink analysis for AT&T you can see the maximum channel sizes for n12 band spectrum (700MHz A/B/C) versus their n29 band spectrum (700MHz D/E),which is downlink only, and their n14 band spectrum (FirstNet); for each county in the New York Cellular Market Area (CMA).


Similarly, the uplink analysis indicates the maximum uplink channel size for all of the uplink spectrum.


The n41 band spectrum that Sprint's controls (2.5GHz) is seen in the Time Division Duplex(TDD) section.  The analysis tool determines the largest contiguous channel that Sprint can deploy with their leases/owned spectrum including the mid-band segment guard bands.  From the results below, Sprint can configure 80MHz 5G/LTE channels in two New York counties and they can configure a 60MHz channel in one additional New York county.  The remaining counties are limited to carrier aggregation of 20MHz channels. 


In the Millimeter Wave - Spectrum Ownership Analysis Tool, all of the spectrum is configured to Time Division Duplex(TDD) operation.  Below, you can see the different bandwidths that T-Mobile can deploy using their 24GHz or 28GHz spectrum in the New York counties.   Each of the 3GPP standardized bandwidths of 400, 200, 100, and 50MHz are detailed for each spectrum band.


AT&T's Low Band 5G | 700MHz or Cellular Thu, May 09, 2019

 Late last year, AT&T began to discuss refarming their low-band spectrum for 5G, but they didn't indicate which of their low band spectrum blocks would be used.  With some spectrum acquisitions that have been filed over the last 6 months, I believe their plans are becoming more clear.  The 3 blocks of low band spectrum that AT&T controls are 700MHz (A,B, and C channels), 700MHz (FirstNet), and the Cellular (A & B channels). I am going to assume that the FirstNet spectrum is not being considered since it must support public safety networks, leaving the 700MHz and Cellular bands for refarming.  The first indicator, was AT&T's acquisition of FBS 700's spectrum in South Dakota and their acquisition of part of C Spire's 700MHz spectrum in the southeast.  

To see AT&T's total 700MHz spectrum, we used Allnet Insights' Mobile Carrier - Spectrum Ownership Analysis Tool to total AT&T's ownership of the 700MHz A, B, and C channels in each US county.  In the counties where they own all three channels, they could deploy a 15MHz 5G channel.  From the map below, it appears that AT&T would cover most of the US with a 10MHz 5G channel.   


 The next map highlights the counties where AT&T controls both cellular channels (A & B).  In the limited markets where they control both channels (Texas and Florida), they could have a 5G channel size of 20MHz, but for most of the country that would be limited to a 10MHz 5G channel size.  It is important to remember that the areas where AT&T doesn't control any cellular spectrum the bands are controlled by USCellular and/or Verizon, making cellular spectrum acquisitions unlikely.

 Another important way to evaluate the usefulness of each band is to measure the amount of population that can be reach with the licenses in each band.  To evaluate this we used the Licensed POPs Analysis Module from the Mobile Carrier - Spectrum Ownership Analysis Tool.  Since AT&T's 700MHz spectrum covers 44 million addition people compared to AT&T's Cellular spectrum, I believe that AT&T is planning to utilize their 700MHz spectrum for their upcoming Low Band 5G deployments.  This appears to be confirmed by AT&T's recent acquisitions.


Are AT&T and Verizon Leveraging Temporary Licenses for Millimeter 5G? Tue, Apr 02, 2019

Recently in our spectrum transaction tracking we discovered some Millimeter Wave Special Temporary Authority (STA) licenses that AT&T and Verizon have filed in the 39GHz band to conduct wideband testing and for AT&T it appears the spectrum will be used for a market launch later this year.  

To see what is going on, let's look at Verizon and AT&T's ownership of the 39GHz band in the Chicago PEA market (PEA003) with our Spectrum Grid module.  The Spectrum Grid modules is one of nineteen analysis modules in our Millimeter Wave - Spectrum Ownership Analysis Tool.  Below you can see the specific channels that AT&T and Verizon control.  This spectrum is still paired, meaning the lower channels are for uplink and the upper channels are for downlink.  It is apparent that Verizon and AT&T's channels are commingled and that neither carrier can utilize a channel larger than 150MHz (AT&T is limited to 50MHz).  You can see 4 channels that the FCC does control in the lower band, but these are not the channels that AT&T or Verizon requested in their STA.

They each requested channels in the new 37GHz band which will be auctioned later this year.  This spectrum is adjacent to the existing 39GHz licensed bands

The spectrum allocations that Verizon and AT&T have requested in Chicago are indicated below.

This allocation provides both AT&T and Verizon with 400MHz for wideband 5G.  For AT&T, this is likely the spectrum they will utilize for the Chicago market launch announced for later this year.  Verizon likely launched their 5G UWB network using the 28GHz L1 and L2 spectrum seen below, so this 37GHz allotment is likely for network testing.

We have highlighted the effect of the temporary licenses in the Chicago (PEA003).  We noted that AT&T has also requested STA licenses in Raleigh (PEA045), Oklahoma City (PEA039), Charlotte (PEA043) and Philadelphia (PEA006).  Verizon requested STA licenses in New York (PEA001), Cleveland (PEA014), Cincinnati (PEA025), and Tallahassee (PEA072)


39GHz - Auction 103 Reconfiguration Analysis - Number Blocks Tue, Mar 26, 2019

On March 21st, the FCC released a Notice of Procedures describing how existing 39GHz spectrum ownership below will be remapped to the new 39GHz configuration.  We thought it would be beneficial to see how the FCC arrived at their results.

Current Configuration:

Future Configuration:

The procedures the FCC announced will provide a route for the existing 39GHz owners to essentially trade-in their spectrum for vouchers that can be used in Auction 103.  The FCC published a summary of the aggregated holdings data for each of the 39GHz licensees so we decided to use the data from our Millimeter Wave - Spectrum Ownership Analysis Tool to show the underlying calculations.

We are able to use the data from our Millimeter Wave - Spectrum Ownership Analysis Tool to determine the aggregate MHz-POPs value for PEA003 (Chicago).  To find the aggregate MHz-POPs we must first find the MHz-POPs contribution for each of AT&T's licenses (call signs) in the Chicago market.  Below are each of the county MHz-POPs components for each call sign.  We have indicated whether the license covers the entire county or whether it is a partial license in the Full/Partial County column.  The county MHz-POPs component is found by multiplying the bandwidth for each call sign by the county population.  The total aggregate MHz-POPs is the sum of the county MHz-POPs for all of AT&T's licenses.  Using this process, we have found AT&T's aggregate MHz-POPs to by 2,817,188,800 compared to the FCC's results of 2,815,434,000.

Market CallSign Channel Block Full/Partial County State County Bandwidth County Population MHz-POPs
PEA003 WRBI252 1A Full IL Cook County 50 5,194,675 259,733,750
Chicago DuPage County 50 916,924 45,846,200
Grundy County 50 50,063 2,503,150
Kane County 50 515,269 25,763,450
Kankakee County 50 113,449 5,672,450
Kendall County 50 114,736 5,736,800
Lake County 50 703,462 35,173,100
McHenry County 50 308,760 15,438,000
Will County 50 677,560 33,878,000
IN Lake County 50 496,005 24,800,250
LaPorte County 50 111,467 5,573,350
Porter County 50 164,343 8,217,150
WRBI253 1B Full IL Cook County 50 5,194,675 259,733,750
DuPage County 50 916,924 45,846,200
Grundy County 50 50,063 2,503,150
Kane County 50 515,269 25,763,450
Kankakee County 50 113,449 5,672,450
Kendall County 50 114,736 5,736,800
Lake County 50 703,462 35,173,100
McHenry County 50 308,760 15,438,000
Will County 50 677,560 33,878,000
IN Lake County 50 496,005 24,800,250
LaPorte County 50 111,467 5,573,350
Porter County 50 164,343 8,217,150
WRBI590 4A Full IL Cook County 50 5,194,675 259,733,750
DuPage County 50 916,924 45,846,200
Grundy County 50 50,063 2,503,150
Kane County 50 515,269 25,763,450
Kankakee County 50 113,449 5,672,450
Kendall County 50 114,736 5,736,800
Lake County 50 703,462 35,173,100
McHenry County 50 308,760 15,438,000
Will County 50 677,560 33,878,000
IN Lake County 50 496,005 24,800,250
LaPorte County 50 111,467 5,573,350
Porter County 50 164,343 8,217,150
WRBI591 4B Full IL Cook County 50 5,194,675 259,733,750
DuPage County 50 916,924 45,846,200
Grundy County 50 50,063 2,503,150
Kane County 50 515,269 25,763,450
Kankakee County 50 113,449 5,672,450
Kendall County 50 114,736 5,736,800
Lake County 50 703,462 35,173,100
McHenry County 50 308,760 15,438,000
Will County 50 677,560 33,878,000
IN Lake County 50 496,005 24,800,250
LaPorte County 50 111,467 5,573,350
Porter County 50 164,343 8,217,150
WRBJ298 8A Full IL Cook County 50 5,194,675 259,733,750
DuPage County 50 916,924 45,846,200
Grundy County 50 50,063 2,503,150
Kane County 50 515,269 25,763,450
Kankakee County 50 113,449 5,672,450
Kendall County 50 114,736 5,736,800
Lake County 50 703,462 35,173,100
McHenry County 50 308,760 15,438,000
Will County 50 677,560 33,878,000
IN Lake County 50 496,005 24,800,250
LaPorte County 50 111,467 5,573,350
Porter County 50 164,343 8,217,150
WRBJ299 8B Full IL Cook County 50 5,194,675 259,733,750
DuPage County 50 916,924 45,846,200
Grundy County 50 50,063 2,503,150
Kane County 50 515,269 25,763,450
Kankakee County 50 113,449 5,672,450
Kendall County 50 114,736 5,736,800
Lake County 50 703,462 35,173,100
McHenry County 50 308,760 15,438,000
Will County 50 677,560 33,878,000
IN Lake County 50 496,005 24,800,250
LaPorte County 50 111,467 5,573,350
Porter County 50 164,343 8,217,150
WRBK275 13A Partial IL Kane County 50 21,235 1,061,750
Kendall County 50 13,076 653,800
McHenry County 50 37,438 1,871,900
13B Partial IL Kane County 50 21,235 1,061,750
Kendall County 50 13,076 653,800
McHenry County 50 37,438 1,871,900
2,817,188,800


The Market MHz-POPs value is found by multiplying the new 39GHz channel size (100MHz) by the total population of the Chicago PEA.  

Market Bandwidth PEA Population Market MHz-POPs
PEA003 (Chicago) 100 9,366,713 936,671,300


The next calculation provides the number of blocks that AT&T is authorized to receive in the 39GHz auction by relinquishing their current licenses.  Our analysis indicates that AT&T will start with slightly more than 3 - 100MHz channel blocks in Chicago before the auction starts.

Market Aggregate MHz-POPs Market MHz-POPs Channel Blocks
PEA003 (Chicago) 2,817,188,800 936,671,300 3.00766


Licensed Spectrum Survey for DAS and Small Cell Implementation Mon, Nov 05, 2018

Two questions for all of the wireless network installers and drive testers:

1)  Where can you get the spectrum assignments for all of the mobile carrier bands with in a county?

2)  How can you determine if the licensed spectrum assignment will change in the near future?

Allnet Insights' Web Spectrum Viewer now includes a Wireless Survey which details the wireless carrier that currently controls each block of Mobile Carrier spectrum (600MHz-2.5GHz) for a selected US county.  In addition, the Wireless Survey indicates whether there are any filed transaction that will move that spectrum to another wireless carrier, as indicated in the Future column.

The output table details the spectrum assignments,licensees, and bandwidth for each block and is sorted from lowest frequency to highest frequency.  This output table can be exported as a .csv file.  


Weekly FCC Spectrum Transactions Mon, Oct 22, 2018

Since blog postings of our Weekly Spectrum Transaction Summary emails are behind a subscription wall, I am posting last week's summary to show the detailed information that will arrive at your inbox every Friday, covering both the Mobile Carrier (600MHz-2.5GHz) and Millimeter Wave (12.2GHz-47GHz) transactions filed the previous week.
FCC Transactions - October 17, 2018
In this week's FCC transactions we see 4 transaction themes.  First, we see Cimaron Telephone / Cross Cable leasing an AWS3 license from Cross Telephone (a parent company).  Second, we see GE MDS leasing 4 - 700MHz Guard band licenses across the South and Southwest.  Third, we see a large filing from SpeedConnect providing them access to a varying number of channels on 35 call signs across the midwest, primarily in rural or low population areas.  The owned BRS channels are involved in most of these transactions which is surprising because it is Sprint's premium spectrum holding in all of these markets.  Most of these channels cover entire BTA market areas with contiguous spectrum.  Fourth, we see T-Mobile leasing RigNet's 700MHz C band license covering the entire Gulf of Mexico.  This will enable T-Mobile to build their LTE network for the oil platforms in the gulf.
Purpose Assignee Assignor CallSign Map RadioService Market ChannelBlock
New Lease Cimaron Telephone Cross Telephone Company WRBQ838 AWS3 CMA598 - Oklahoma 3 - Grant G
New Lease GE MDS LLC Access 700 WPRR314 700MHz GB MEA025 - Nashville A
New Lease GE MDS LLC Access 700 WPRV427 700MHz GB MEA008 - Atlanta A
New Lease GE MDS LLC Access 700 WPRV430 700MHz GB MEA024 - Birmingham A
New Lease GE MDS LLC Access 700 WPRV439 700MHz GB MEA038 - San Antonio A
New Lease SpeedConnect Sprint B064 Map BRS BTA064 - Butte, MT BRS1
New Lease SpeedConnect Sprint B064 Map BRS BTA064 - Butte, MT E4
New Lease SpeedConnect Sprint B064 Map BRS BTA064 - Butte, MT F1
New Lease SpeedConnect Sprint B064 Map BRS BTA064 - Butte, MT F2
New Lease SpeedConnect Sprint B064 Map BRS BTA064 - Butte, MT F3
New Lease SpeedConnect Sprint B064 Map BRS BTA064 - Butte, MT F4
New Lease SpeedConnect Sprint B064 Map BRS BTA064 - Butte, MT H1
New Lease SpeedConnect Sprint B064 Map BRS BTA064 - Butte, MT H2
New Lease SpeedConnect Sprint B064 Map BRS BTA064 - Butte, MT H3
New Lease SpeedConnect Sprint B144 Map BRS BTA144 - Flagstaff, AZ BRS1
New Lease SpeedConnect Sprint B144 Map BRS BTA144 - Flagstaff, AZ E4
New Lease SpeedConnect Sprint B144 Map BRS BTA144 - Flagstaff, AZ F4
New Lease SpeedConnect Sprint B167 Map BRS BTA167 - Grand Island-Kearney, NE BRS1
New Lease SpeedConnect Sprint B171 Map BRS BTA171 - Great Falls, MT BRS2
New Lease SpeedConnect Sprint B171 Map BRS BTA171 - Great Falls, MT E1
New Lease SpeedConnect Sprint B171 Map BRS BTA171 - Great Falls, MT E2
New Lease SpeedConnect Sprint B171 Map BRS BTA171 - Great Falls, MT E3
New Lease SpeedConnect Sprint B171 Map BRS BTA171 - Great Falls, MT E4
New Lease SpeedConnect Sprint B171 Map BRS BTA171 - Great Falls, MT F1
New Lease SpeedConnect Sprint B171 Map BRS BTA171 - Great Falls, MT F4
New Lease SpeedConnect Sprint B202 Map BRS BTA202 - Idaho Falls, ID BRS1
New Lease SpeedConnect Sprint B202 Map BRS BTA202 - Idaho Falls, ID BRS2
New Lease SpeedConnect Sprint B202 Map BRS BTA202 - Idaho Falls, ID E4
New Lease SpeedConnect Sprint B202 Map BRS BTA202 - Idaho Falls, ID F4
New Lease SpeedConnect Sprint B205 Map BRS BTA205 - Iowa City, IA BRS1
New Lease SpeedConnect Sprint B205 Map BRS BTA205 - Iowa City, IA BRS2
New Lease SpeedConnect Sprint B205 Map BRS BTA205 - Iowa City, IA E4
New Lease SpeedConnect Sprint B205 Map BRS BTA205 - Iowa City, IA F4
New Lease SpeedConnect Sprint B300 Map BRS BTA300 - Missoula, MT BRS1
New Lease SpeedConnect Sprint B353 Map BRS BTA353 - Pocatello, ID BRS1
New Lease SpeedConnect Sprint B353 Map BRS BTA353 - Pocatello, ID BRS2
New Lease SpeedConnect Sprint B353 Map BRS BTA353 - Pocatello, ID E4
New Lease SpeedConnect Sprint B353 Map BRS BTA353 - Pocatello, ID F4
New Lease SpeedConnect Sprint B422 Map BRS BTA422 - Sioux Falls, SD BRS1
New Lease SpeedConnect Sprint B422 Map BRS BTA422 - Sioux Falls, SD BRS2
New Lease SpeedConnect Sprint B422 Map BRS BTA422 - Sioux Falls, SD E4
New Lease SpeedConnect Sprint B422 Map BRS BTA422 - Sioux Falls, SD F4
New Lease SpeedConnect Sprint B451 Map BRS BTA451 - Twin Falls, ID BRS1
New Lease SpeedConnect Sprint B451 Map BRS BTA451 - Twin Falls, ID E4
New Lease SpeedConnect Sprint B451 Map BRS BTA451 - Twin Falls, ID F4
New Lease SpeedConnect Sprint WFY431 Map BRS P00089 - P35 GSA,40-43-38 N,99-7-41.3 W BRS1
New Lease SpeedConnect Sprint WFY595 Map BRS P03002 - P35 GSA,41-32-48.1 N,90-27-56.5 W BRS1
New Lease SpeedConnect Sprint WGW275 Map BRS P03471 - P35 GSA,43-28-24.1 N,83-50-39.9 W E4
New Lease SpeedConnect Sprint WHI959 Map BRS P00168 - P35 GSA,43-59-30.9 N,96-46-11.2 W F4
New Lease SpeedConnect Sprint WHT588 Map BRS P03685 - P35 GSA,41-31-58.1 N,90-34-40.5 W E4
New Lease SpeedConnect Sprint WLK328 Map BRS P01359 - P35 GSA,43-14-38 N,97-22-39.2 W F4
New Lease SpeedConnect Sprint WLK384 Map BRS P01362 - P35 GSA,43-14-38 N,97-22-39.2 W E4
New Lease SpeedConnect Sprint WLW827 Map BRS P01384 - P35 GSA,31-25-16.6 N,100-32-37.3 W F1234
New Lease SpeedConnect Sprint WLW894 Map BRS P01898 - P35 GSA,41-31-58.1 N,90-34-40.5 W F4
New Lease SpeedConnect Sprint WMH800 Map BRS P02690 - P35 GSA,34-13-58.1 N,112-22-15.6 W E4
New Lease SpeedConnect Sprint WMI345 Map BRS P01925 - P35 GSA,41-54-33 N,91-39-17.6 W E4
New Lease SpeedConnect Sprint WMI827 Map BRS P02939 - P35 GSA,34-42-17.1 N,112-6-57.6 W E4
New Lease SpeedConnect Sprint WMI864 Map BRS P02941 - P35 GSA,34-42-17.1 N,112-6-57.6 W F4
New Lease SpeedConnect Sprint WML478 Map BRS P03544 - P35 GSA,31-25-16.6 N,100-32-37.3 W BRS1
New Lease SpeedConnect Sprint WMX344 Map BRS P03719 - P35 GSA,43-30-10.9 N,96-34-39.2 W F4
New Lease SpeedConnect Sprint WMX358 Map BRS P01947 - P35 GSA,43-30-10.9 N,96-34-39.2 W E4
New Lease SpeedConnect Sprint WMX656 Map EBS P00155 - P35 GSA,42-43-54 N,114-25-7 W D1234
New Lease SpeedConnect Sprint WMX678 Map EBS P00017 - P35 GSA,42-43-54 N,114-25-7 W C1234
New Lease SpeedConnect Sprint WMX908 Map BRS P03551 - P35 GSA,31-25-16.6 N,100-32-37.3 W E1234
New Lease SpeedConnect Sprint WNTC543 Map BRS P01566 - P35 GSA,31-25-16.6 N,100-32-37.3 W H1
New Lease SpeedConnect Sprint WNTC543 Map BRS P01566 - P35 GSA,31-25-16.6 N,100-32-37.3 W H2
New Lease SpeedConnect Sprint WQLW472 Map BRS BTA070 - Cedar Rapids, IA BRS2
New Lease SpeedConnect Sprint WQLW472 Map BRS BTA070 - Cedar Rapids, IA E4
New Lease SpeedConnect Sprint WQLW472 Map BRS BTA070 - Cedar Rapids, IA F4
New Lease SpeedConnect Sprint WQLW474 Map BRS BTA105 - Davenport, IA-Moline, IL BRS2
New Lease SpeedConnect Sprint WLW970 Map BRS P02673 - P35 GSA,35-14-2 N,111-36-27.6 W F4
New Lease SpeedConnect Sprint WMI320 Map BRS P02694 - P35 GSA,35-14-29 N,111-36-37.6 W E4
New Lease SpeedConnect Sprint B011 Map BRS BTA011 - Alpena, MI BRS1
New Lease SpeedConnect Sprint B011 Map BRS BTA011 - Alpena, MI E4
New Lease SpeedConnect Sprint B011 Map BRS BTA011 - Alpena, MI F1
New Lease SpeedConnect Sprint B011 Map BRS BTA011 - Alpena, MI F2
New Lease SpeedConnect Sprint B011 Map BRS BTA011 - Alpena, MI F3
New Lease SpeedConnect Sprint B011 Map BRS BTA011 - Alpena, MI F4
New Lease SpeedConnect Sprint B011 Map BRS BTA011 - Alpena, MI H1
New Lease SpeedConnect Sprint B011 Map BRS BTA011 - Alpena, MI H2
New Lease SpeedConnect Sprint B011 Map BRS BTA011 - Alpena, MI H3
New Lease SpeedConnect Sprint B307 Map BRS BTA307 - Mt. Pleasant, MI E4
New Lease SpeedConnect Sprint B307 Map BRS BTA307 - Mt. Pleasant, MI F4
New Lease SpeedConnect Sprint B390 Map BRS BTA390 - Saginaw-Bay City, MI E4
New Lease SpeedConnect Sprint B390 Map BRS BTA390 - Saginaw-Bay City, MI F4
New Lease T-Mobile RigNet WPWV330 700MHz CMA306 - Gulf of Mexico C

Millimeter Wave - Upper Microwave Flexible Use (Auction Channels) Thu, Aug 30, 2018

In our Millimeter Wave - Spectrum Ownership Analysis Tool, we have incorporated the FCC's re-licensing of the LMDS A band (27.500-28.350GHz) into the new Upper Microwave Flexible Use Service.  In making this change the FCC issued new call signs and leases for all of the previous LMDS A band BTA area licenses with L1 and L2 band Upper Microwave Flexible Use Service channels.  In the new framework (and our database) a new call sign was release for each channel (L1, L2) by county.  The remaining A band licenses remained LMDS licenses.
Spectrum Grid:
County Analysis:
As you can see in the image below, we still provide the county-level spectrum depth by frequency band for the entire LMDS band (purple).
But we also break out the L1, L2, A, and B channel's spectrum depth separately.  This is a useful view to determine if the L1/L2 channels will be available from the FCC in the November auction.

New Millimeter Wave Spectrum Bands Thu, Apr 05, 2018

In our last post we were discussing  the next steps for the US millimeter wave spectrum after FiberTower and the FCC settled FiberTower's licensing issues.  As we prepare for a 28GHz auction in November, and a 24GHz auction early next year, let's take a look at how each of the new millimeter wave frequency bands are configured.  Each of these images is taken from our updated Millimeter Wave - Spectrum Ownership Analysis Tool which is now reflecting the new channel band plans for 24GHz, 37GHz, and 47GHz.

24 GHz Spectrum:

In this view we show both the expanded 24GHz band configuration and the old 24GHz configuration. All of the spectrum depth values are calculated from the New 24GHz data. We have left the old 24GHz configuration, so you can continue to see the remaining 24GHz spectrum licenses which will need to be moved over to the New 24GHz by the FCC. The current licenses are licensed for a 40MHz uplink and 40MHz downlink which won't map properly to the new band plan.

37GHz Spectrum:

For the 37/39GHz bands we show the new 37GHz band alongside the reconfigured 39GHz band.  The new 39GHz columns are not populated because the existing spectrum holders will need to be transitioned to the larger/unpaired channels in the new 39GHz plan.  We are providing spectrum depth values for the new 37GHz spectrum and the old 39GHz spectrum.

47GHz Spectrum:

We have added the new 47GHz band configurations to the Spectrum Grid and each of the spectrum depth modules.

PEA Market Analysis:

Our last addition, is a PEA Market Analysis module.  This module displays spectrum depths for each selected carrier using the new FCC Auction market structure.  For the 28GHz auction, you can see the amount of spectrum that will be available in each of the PEAs in the LMDS A (FCC) column on the far right of the chart.


Visualize 600MHz Reserved Spectrum Thu, Sep 07, 2017

With the September 2017 release of our Mobile Carrier - Spectrum Ownership Analysis Tool, we have also added the ability to visualize and track the 600MHz reserved spectrum by county or by market.

In our Spectrum Grid default view, you are able to visualize which spectrum blocks are designated as reserved for the counties in each of the most populated Cellular Market Area (CMA) markets.


To display the reserved spectrum for all of the counties within a Partial Economic Area (PEA) market, you can sort the county data using the PEA # column.


Tracking the FirstNet Opt-in Responses and their Cumulative Effect (Licensed Population) Tue, Aug 08, 2017

As more states have have announced that they have agreed to opt-in for a nationwide public-safety broadband network that will be built and operated by AT&T, we are going to look at Spektrum Metrics Insights' tools to see several ways that the effects of these opt-ins can both be seen and analyzed.  All of our products are updated monthly to reflect the continuous change in the US licensed spectrum landscape.

The first view is the county by county view in the Web Spectrum Viewer.  In the screen shot below, we are looking at the current owners of the public-safety spectrum (the right 2 columns) which highlight the counties/states where Firstnet (FSN) is still the assigned current owner.  In this view, you can see the New Jersey counties in the New York CMA, the New Jersey counties in the Philadelphia CMA, and the Michigan counties in the Detroit CMA; are all opting in for an AT&T operated network.

Selecting one of the county_channel cells coded with FSN (Bronx county, NY) will reveal a detailed view of a non-opt-in county.  FirstNet is still licensed for that channel, and the current operator, but AT&T is still expected to be the future operator.

An AT&T coded cell (Somerset county, NJ) will reveal a detailed view of a opt-in county.  AT&T is indicated as the licensee, as well as the current and future operator of that channel.

Last, we are going to use the Channel Licensed POPs module from the Mobile Carrier - Spectrum Ownership Analysis Tool to determine how much of the US Population is locked in with AT&T operating the FirstNet spectrum.

Looking under the column for PSBB (Public Safety Broadband), you can see that with the existing 6 states that have opted-in, AT&T controls the FirstNet spectrum over a population of 42 million or roughly 13% of the US population (322 million total).  You can also see the population percentages that AT&T can reach with each of the other 700 MHz channels that they own or lease across the country.


my wishlist